- India
- /
- Industrials
- /
- NSEI:3MINDIA
The total return for 3M India (NSE:3MINDIA) investors has risen faster than earnings growth over the last three years


Low-cost index funds make it easy to achieve average market returns. But across the board there are plenty of stocks that underperform the market. That's what has happened with the 3M India Limited (NSE:3MINDIA) share price. It's up 57% over three years, but that is below the market return. Having said that, the 43% increase over the past year is good to see.
While this past week has detracted from the company's three-year return, let's look at the recent trends of the underlying business and see if the gains have been in alignment.
Check out our latest analysis for 3M India
While markets are a powerful pricing mechanism, share prices reflect investor sentiment, not just underlying business performance. One way to examine how market sentiment has changed over time is to look at the interaction between a company's share price and its earnings per share (EPS).
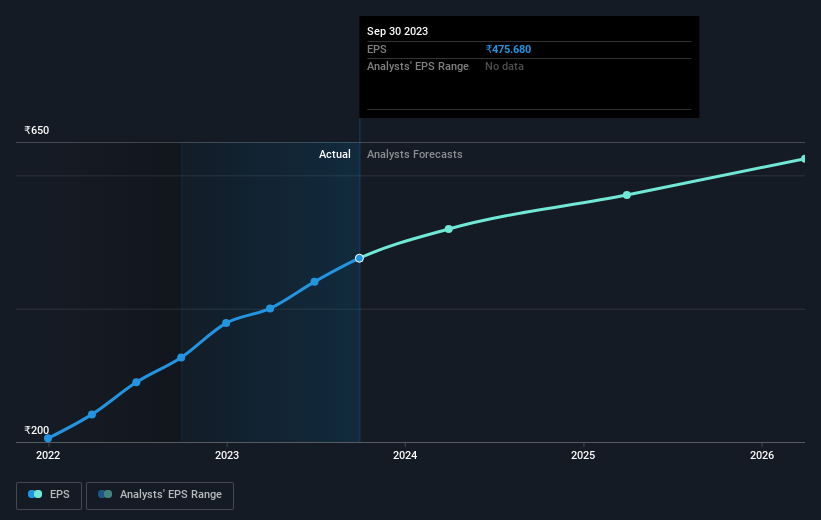
3M India was able to grow its EPS at 48% per year over three years, sending the share price higher. The average annual share price increase of 16% is actually lower than the EPS growth. So it seems investors have become more cautious about the company, over time. Of course, with a P/E ratio of 69.13, the market remains optimistic.
The image below shows how EPS has tracked over time (if you click on the image you can see greater detail).
It is of course excellent to see how 3M India has grown profits over the years, but the future is more important for shareholders. It might be well worthwhile taking a look at our free report on how its financial position has changed over time.
What About Dividends?
It is important to consider the total shareholder return, as well as the share price return, for any given stock. The TSR incorporates the value of any spin-offs or discounted capital raisings, along with any dividends, based on the assumption that the dividends are reinvested. Arguably, the TSR gives a more comprehensive picture of the return generated by a stock. As it happens, 3M India's TSR for the last 3 years was 63%, which exceeds the share price return mentioned earlier. And there's no prize for guessing that the dividend payments largely explain the divergence!
A Different Perspective
3M India provided a TSR of 43% over the year (including dividends). That's fairly close to the broader market return. That gain looks pretty satisfying, and it is even better than the five-year TSR of 10% per year. It is possible that management foresight will bring growth well into the future, even if the share price slows down. It's always interesting to track share price performance over the longer term. But to understand 3M India better, we need to consider many other factors. Take risks, for example - 3M India has 1 warning sign we think you should be aware of.
Of course, you might find a fantastic investment by looking elsewhere. So take a peek at this free list of companies we expect will grow earnings.
Please note, the market returns quoted in this article reflect the market weighted average returns of stocks that currently trade on Indian exchanges.
Valuation is complex, but we're here to simplify it.
Discover if 3M India might be undervalued or overvalued with our detailed analysis, featuring fair value estimates, potential risks, dividends, insider trades, and its financial condition.
Access Free AnalysisHave feedback on this article? Concerned about the content? Get in touch with us directly. Alternatively, email editorial-team (at) simplywallst.com.
This article by Simply Wall St is general in nature. We provide commentary based on historical data and analyst forecasts only using an unbiased methodology and our articles are not intended to be financial advice. It does not constitute a recommendation to buy or sell any stock, and does not take account of your objectives, or your financial situation. We aim to bring you long-term focused analysis driven by fundamental data. Note that our analysis may not factor in the latest price-sensitive company announcements or qualitative material. Simply Wall St has no position in any stocks mentioned.
About NSEI:3MINDIA
3M India
Manufactures and trades in various products for the automotive, commercial solutions, consumer markets, design and construction, electronics, energy, health care, manufacturing, safety, and transportation industries in India and internationally.
Outstanding track record with flawless balance sheet.
