
Advertisement

Finding a business that has the potential to grow substantially is not easy, but it is possible if we look at a few key financial metrics. One common approach is to try and find a company with returns on capital employed (ROCE) that are increasing, in conjunction with a growing amount of capital employed. Put simply, these types of businesses are compounding machines, meaning they are continually reinvesting their earnings at ever-higher rates of return. However, after briefly looking over the numbers, we don't think Wheels India (NSE:WHEELS) has the makings of a multi-bagger going forward, but let's have a look at why that may be.
What is Return On Capital Employed (ROCE)?
If you haven't worked with ROCE before, it measures the 'return' (pre-tax profit) a company generates from capital employed in its business. To calculate this metric for Wheels India, this is the formula:
Return on Capital Employed = Earnings Before Interest and Tax (EBIT) ÷ (Total Assets - Current Liabilities)
0.015 = ₹152m ÷ (₹20b - ₹10b) (Based on the trailing twelve months to September 2020).
Thus, Wheels India has an ROCE of 1.5%. In absolute terms, that's a low return and it also under-performs the Auto Components industry average of 6.7%.
See our latest analysis for Wheels India
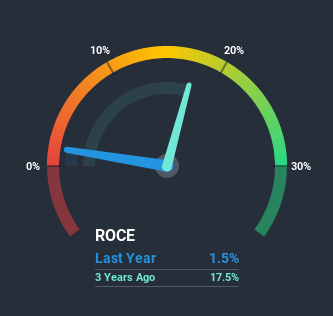
Historical performance is a great place to start when researching a stock so above you can see the gauge for Wheels India's ROCE against it's prior returns. If you're interested in investigating Wheels India's past further, check out this free graph of past earnings, revenue and cash flow.
What The Trend Of ROCE Can Tell Us
On the surface, the trend of ROCE at Wheels India doesn't inspire confidence. Around five years ago the returns on capital were 16%, but since then they've fallen to 1.5%. And considering revenue has dropped while employing more capital, we'd be cautious. This could mean that the business is losing its competitive advantage or market share, because while more money is being put into ventures, it's actually producing a lower return - "less bang for their buck" per se.
On a separate but related note, it's important to know that Wheels India has a current liabilities to total assets ratio of 51%, which we'd consider pretty high. This effectively means that suppliers (or short-term creditors) are funding a large portion of the business, so just be aware that this can introduce some elements of risk. Ideally we'd like to see this reduce as that would mean fewer obligations bearing risks.In Conclusion...
We're a bit apprehensive about Wheels India because despite more capital being deployed in the business, returns on that capital and sales have both fallen. Long term shareholders who've owned the stock over the last five years have experienced a 16% depreciation in their investment, so it appears the market might not like these trends either. That being the case, unless the underlying trends revert to a more positive trajectory, we'd consider looking elsewhere.
One more thing: We've identified 3 warning signs with Wheels India (at least 2 which are concerning) , and understanding these would certainly be useful.
While Wheels India isn't earning the highest return, check out this free list of companies that are earning high returns on equity with solid balance sheets.
If you’re looking to trade Wheels India, open an account with the lowest-cost* platform trusted by professionals, Interactive Brokers. Their clients from over 200 countries and territories trade stocks, options, futures, forex, bonds and funds worldwide from a single integrated account. Promoted
Valuation is complex, but we're here to simplify it.
Discover if Wheels India might be undervalued or overvalued with our detailed analysis, featuring fair value estimates, potential risks, dividends, insider trades, and its financial condition.
Access Free AnalysisThis article by Simply Wall St is general in nature. It does not constitute a recommendation to buy or sell any stock, and does not take account of your objectives, or your financial situation. We aim to bring you long-term focused analysis driven by fundamental data. Note that our analysis may not factor in the latest price-sensitive company announcements or qualitative material. Simply Wall St has no position in any stocks mentioned.
*Interactive Brokers Rated Lowest Cost Broker by StockBrokers.com Annual Online Review 2020
Have feedback on this article? Concerned about the content? Get in touch with us directly. Alternatively, email editorial-team@simplywallst.com.
About NSEI:WHEELS
Wheels India
Together with its subsidiary, engages in the manufacture and sale of automotive and industrial components in India and internationally.
Solid track record, good value and pays a dividend.
Similar Companies
Market Insights

Advertisement
Community Narratives
Groundbreaking therapies that could change the treatment landscape for PTSD, fibromyalgia, MS & Alzheimer’s
Fair Value US$6.20|86.9% undervalued
CM
Community Contributor
DigitalOcean Will Grow 14% by Embracing AI with Paperspace Acquisition
Fair Value US$50.00|41.7% undervalued
NE
Community Contributor
Viant Technology: A Rising AdTech Challenger in the AI-Powered CTV Market
Fair Value US$38.61|63.2% undervalued
BL
Community Contributor
Volvo will Accelerate Forward into Electric and Autonomous Leadership in Five Years
Fair Value SEK 438.80|39.7% undervalued
UN
Community Contributor