Stock Analysis
Estimating The Intrinsic Value Of Tata Motors Limited (NSE:TATAMTRDVR)


How far off is Tata Motors Limited (NSE:TATAMTRDVR) from its intrinsic value? Using the most recent financial data, we'll take a look at whether the stock is fairly priced by taking the expected future cash flows and discounting them to today's value. One way to achieve this is by employing the Discounted Cash Flow (DCF) model. Models like these may appear beyond the comprehension of a lay person, but they're fairly easy to follow.
Remember though, that there are many ways to estimate a company's value, and a DCF is just one method. If you want to learn more about discounted cash flow, the rationale behind this calculation can be read in detail in the Simply Wall St analysis model.
Check out the opportunities and risks within the IN Auto industry.
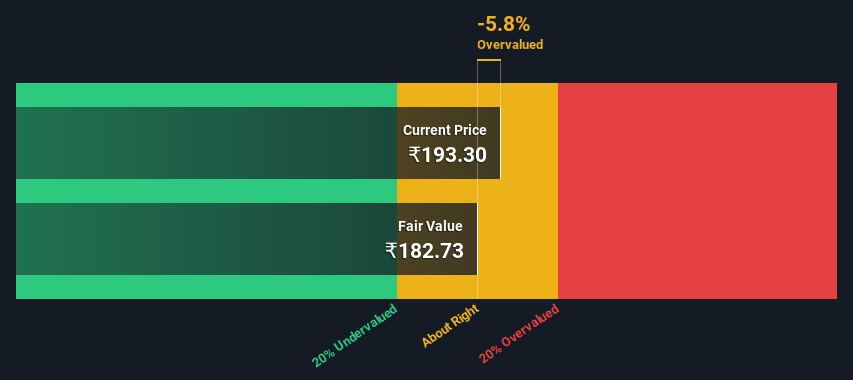
What's The Estimated Valuation?
We are going to use a two-stage DCF model, which, as the name states, takes into account two stages of growth. The first stage is generally a higher growth period which levels off heading towards the terminal value, captured in the second 'steady growth' period. In the first stage we need to estimate the cash flows to the business over the next ten years. Where possible we use analyst estimates, but when these aren't available we extrapolate the previous free cash flow (FCF) from the last estimate or reported value. We assume companies with shrinking free cash flow will slow their rate of shrinkage, and that companies with growing free cash flow will see their growth rate slow, over this period. We do this to reflect that growth tends to slow more in the early years than it does in later years.
Generally we assume that a dollar today is more valuable than a dollar in the future, so we need to discount the sum of these future cash flows to arrive at a present value estimate:
10-year free cash flow (FCF) estimate
| 2023 | 2024 | 2025 | 2026 | 2027 | 2028 | 2029 | 2030 | 2031 | 2032 | |
| Levered FCF (₹, Millions) | ₹174.6b | ₹247.2b | ₹252.1b | ₹260.4b | ₹271.8b | ₹285.6b | ₹301.6b | ₹319.5b | ₹339.4b | ₹361.0b |
| Growth Rate Estimate Source | Analyst x15 | Analyst x17 | Analyst x11 | Est @ 3.31% | Est @ 4.35% | Est @ 5.08% | Est @ 5.6% | Est @ 5.95% | Est @ 6.21% | Est @ 6.38% |
| Present Value (₹, Millions) Discounted @ 21% | ₹144.4k | ₹169.0k | ₹142.5k | ₹121.7k | ₹105.0k | ₹91.2k | ₹79.6k | ₹69.8k | ₹61.3k | ₹53.9k |
("Est" = FCF growth rate estimated by Simply Wall St)
Present Value of 10-year Cash Flow (PVCF) = ₹1.0t
The second stage is also known as Terminal Value, this is the business's cash flow after the first stage. For a number of reasons a very conservative growth rate is used that cannot exceed that of a country's GDP growth. In this case we have used the 5-year average of the 10-year government bond yield (6.8%) to estimate future growth. In the same way as with the 10-year 'growth' period, we discount future cash flows to today's value, using a cost of equity of 21%.
Terminal Value (TV)= FCF2032 × (1 + g) ÷ (r – g) = ₹361b× (1 + 6.8%) ÷ (21%– 6.8%) = ₹2.7t
Present Value of Terminal Value (PVTV)= TV / (1 + r)10= ₹2.7t÷ ( 1 + 21%)10= ₹406b
The total value is the sum of cash flows for the next ten years plus the discounted terminal value, which results in the Total Equity Value, which in this case is ₹1.4t. To get the intrinsic value per share, we divide this by the total number of shares outstanding. Relative to the current share price of ₹193, the company appears around fair value at the time of writing. The assumptions in any calculation have a big impact on the valuation, so it is better to view this as a rough estimate, not precise down to the last cent.
Important Assumptions
We would point out that the most important inputs to a discounted cash flow are the discount rate and of course the actual cash flows. Part of investing is coming up with your own evaluation of a company's future performance, so try the calculation yourself and check your own assumptions. The DCF also does not consider the possible cyclicality of an industry, or a company's future capital requirements, so it does not give a full picture of a company's potential performance. Given that we are looking at Tata Motors as potential shareholders, the cost of equity is used as the discount rate, rather than the cost of capital (or weighted average cost of capital, WACC) which accounts for debt. In this calculation we've used 21%, which is based on a levered beta of 2.000. Beta is a measure of a stock's volatility, compared to the market as a whole. We get our beta from the industry average beta of globally comparable companies, with an imposed limit between 0.8 and 2.0, which is a reasonable range for a stable business.
SWOT Analysis for Tata Motors
- No major strengths identified for TATAMTRDVR.
- Interest payments on debt are not well covered.
- Expected to breakeven next year.
- Has sufficient cash runway for more than 3 years based on current free cash flows.
- Good value based on P/S ratio compared to estimated Fair P/S ratio.
- Debt is not well covered by operating cash flow.
Moving On:
Although the valuation of a company is important, it is only one of many factors that you need to assess for a company. The DCF model is not a perfect stock valuation tool. Preferably you'd apply different cases and assumptions and see how they would impact the company's valuation. For instance, if the terminal value growth rate is adjusted slightly, it can dramatically alter the overall result. For Tata Motors, there are three fundamental elements you should look at:
- Financial Health: Does TATAMTRDVR have a healthy balance sheet? Take a look at our free balance sheet analysis with six simple checks on key factors like leverage and risk.
- Future Earnings: How does TATAMTRDVR's growth rate compare to its peers and the wider market? Dig deeper into the analyst consensus number for the upcoming years by interacting with our free analyst growth expectation chart.
- Other Solid Businesses: Low debt, high returns on equity and good past performance are fundamental to a strong business. Why not explore our interactive list of stocks with solid business fundamentals to see if there are other companies you may not have considered!
PS. The Simply Wall St app conducts a discounted cash flow valuation for every stock on the NSEI every day. If you want to find the calculation for other stocks just search here.
Valuation is complex, but we're helping make it simple.
Find out whether Tata Motors is potentially over or undervalued by checking out our comprehensive analysis, which includes fair value estimates, risks and warnings, dividends, insider transactions and financial health.
View the Free AnalysisHave feedback on this article? Concerned about the content? Get in touch with us directly. Alternatively, email editorial-team (at) simplywallst.com.
This article by Simply Wall St is general in nature. We provide commentary based on historical data and analyst forecasts only using an unbiased methodology and our articles are not intended to be financial advice. It does not constitute a recommendation to buy or sell any stock, and does not take account of your objectives, or your financial situation. We aim to bring you long-term focused analysis driven by fundamental data. Note that our analysis may not factor in the latest price-sensitive company announcements or qualitative material. Simply Wall St has no position in any stocks mentioned.
About NSEI:TATAMTRDVR
Tata Motors
Designs, develops, manufactures, and sells various automotive vehicles.
Solid track record with adequate balance sheet and pays a dividend.
