
Advertisement
- India
- /
- Auto Components
- /
- NSEI:TALBROAUTO
What Kind Of Investor Owns Most Of Talbros Automotive Components Limited (NSE:TALBROAUTO)?

Want to participate in a short research study? Help shape the future of investing tools and you could win a $250 gift card!
If you want to know who really controls Talbros Automotive Components Limited (NSE:TALBROAUTO), then you'll have to look at the makeup of its share registry. Institutions often own shares in more established companies, while it's not unusual to see insiders own a fair bit of smaller companies. I quite like to see at least a little bit of insider ownership. As Charlie Munger said 'Show me the incentive and I will show you the outcome.'
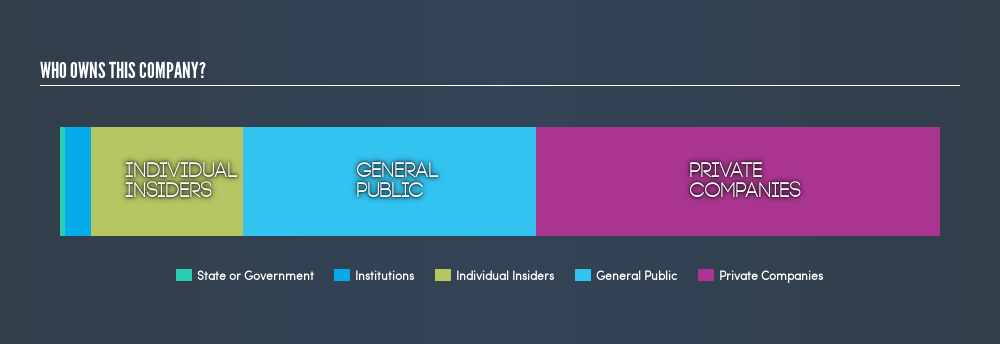
Talbros Automotive Components is not a large company by global standards. It has a market capitalization of ₹2.5b, which means it wouldn't have the attention of many institutional investors. In the chart below below, we can see that institutions are not really that prevalent on the share registry. Let's delve deeper into each type of owner, to discover more about TALBROAUTO.
Check out our latest analysis for Talbros Automotive Components
What Does The Institutional Ownership Tell Us About Talbros Automotive Components?
Institutions typically measure themselves against a benchmark when reporting to their own investors, so they often become more enthusiastic about a stock once it's included in a major index. We would expect most companies to have some institutions on the register, especially if they are growing.
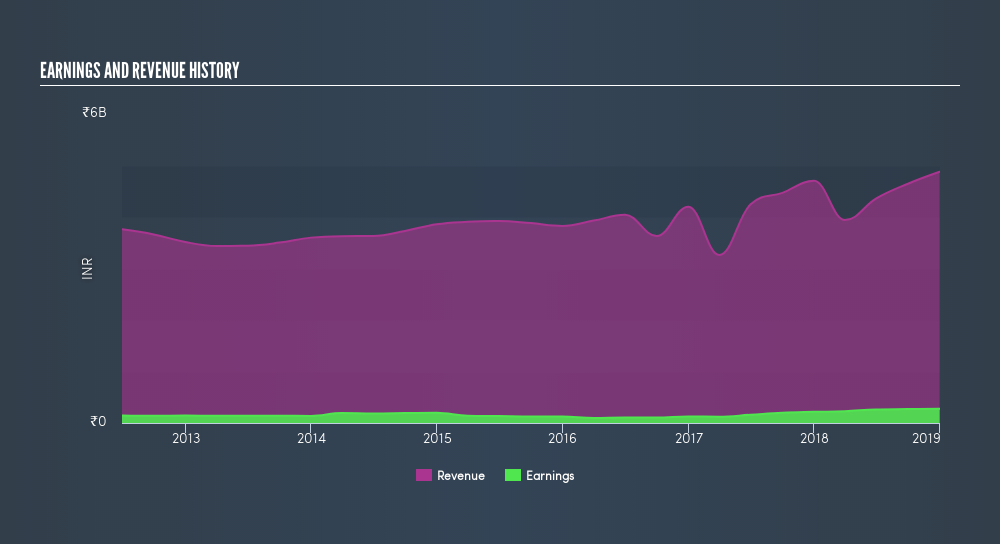
Since institutions own under 5% of Talbros Automotive Components, many may not have spent much time considering the stock. But it's clear that some have; and they liked it enough to buy in. If the business gets stronger from here, we could see a situation where more institutions are keen to buy. When multiple institutional investors want to buy shares, we often see a rising share price. The past revenue trajectory (shown below) can be an indication of future growth, but there are no guarantees.
We note that hedge funds don't have a meaningful investment in Talbros Automotive Components. There is some analyst coverage of the stock, but it could still become more well known, with time.
Insider Ownership Of Talbros Automotive Components
The definition of an insider can differ slightly between different countries, but members of the board of directors always count. Company management run the business, but the CEO will answer to the board, even if he or she is a member of it.
Most consider insider ownership a positive because it can indicate the board is well aligned with other shareholders. However, on some occasions too much power is concentrated within this group.
It seems insiders own a significant proportion of Talbros Automotive Components Limited. Insiders own ₹428m worth of shares in the ₹2.5b company. I would say this shows alignment with shareholders, but it is worth noting that the company is still quite small; some insiders may have founded the business. You can click here to see if those insiders have been buying or selling.
General Public Ownership
The general public holds a 33% stake in TALBROAUTO. While this group can't necessarily call the shots, it can certainly have a real influence on how the company is run.
Private Company Ownership
Our data indicates that Private Companies hold 46%, of the company's shares. Private companies may be related parties. Sometimes insiders have an interest in a public company through a holding in a private company, rather than in their own capacity as an individual. While it's hard to draw any broad stroke conclusions, it is worth noting as an area for further research.
Next Steps:
I find it very interesting to look at who exactly owns a company. But to truly gain insight, we need to consider other information, too.
I always like to check for a history of revenue growth. You can too, by accessing this free chart of historic revenue and earnings in this detailed graph.
If you would prefer discover what analysts are predicting in terms of future growth, do not miss this freereport on analyst forecasts.
NB: Figures in this article are calculated using data from the last twelve months, which refer to the 12-month period ending on the last date of the month the financial statement is dated. This may not be consistent with full year annual report figures.
We aim to bring you long-term focused research analysis driven by fundamental data. Note that our analysis may not factor in the latest price-sensitive company announcements or qualitative material.
If you spot an error that warrants correction, please contact the editor at editorial-team@simplywallst.com. This article by Simply Wall St is general in nature. It does not constitute a recommendation to buy or sell any stock, and does not take account of your objectives, or your financial situation. Simply Wall St has no position in the stocks mentioned. Thank you for reading.
About NSEI:TALBROAUTO
Talbros Automotive Components
Engages in the manufacture and sale of auto components in India.
Flawless balance sheet second-rate dividend payer.
Similar Companies
Market Insights


Advertisement
Community Narratives
For the Emperor: Why Games Workshop Could Be a Star Investment
Fair Value UK£160.00|0.4% overvalued
RO
Community Contributor
Securitas will boost margins with AI and tech-driven services
Fair Value SEK 260.91|44.5% undervalued
UN
Community Contributor
A Leader in EV Charging with Growth Potential
Fair Value €27.00|17.8% undervalued
TI
Community Contributor