
Advertisement
The external fund manager backed by Berkshire Hathaway's Charlie Munger, Li Lu, makes no bones about it when he says 'The biggest investment risk is not the volatility of prices, but whether you will suffer a permanent loss of capital.' When we think about how risky a company is, we always like to look at its use of debt, since debt overload can lead to ruin. We note that Sundram Fasteners Limited (NSE:SUNDRMFAST) does have debt on its balance sheet. But the more important question is: how much risk is that debt creating?
Our free stock report includes 1 warning sign investors should be aware of before investing in Sundram Fasteners. Read for free now.Why Does Debt Bring Risk?
Generally speaking, debt only becomes a real problem when a company can't easily pay it off, either by raising capital or with its own cash flow. Part and parcel of capitalism is the process of 'creative destruction' where failed businesses are mercilessly liquidated by their bankers. However, a more frequent (but still costly) occurrence is where a company must issue shares at bargain-basement prices, permanently diluting shareholders, just to shore up its balance sheet. Of course, the upside of debt is that it often represents cheap capital, especially when it replaces dilution in a company with the ability to reinvest at high rates of return. The first thing to do when considering how much debt a business uses is to look at its cash and debt together.
What Is Sundram Fasteners's Debt?
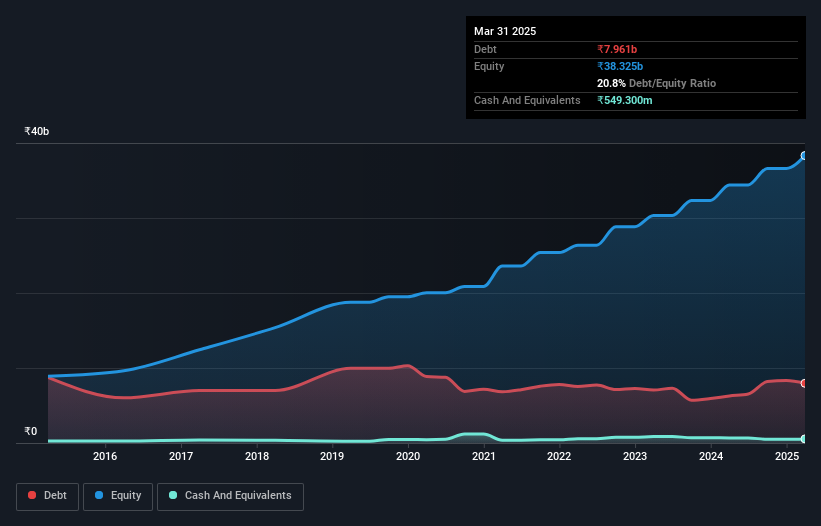
As you can see below, at the end of March 2025, Sundram Fasteners had ₹7.96b of debt, up from ₹6.28b a year ago. Click the image for more detail. However, it also had ₹549.3m in cash, and so its net debt is ₹7.41b.
How Healthy Is Sundram Fasteners' Balance Sheet?
According to the last reported balance sheet, Sundram Fasteners had liabilities of ₹14.2b due within 12 months, and liabilities of ₹2.72b due beyond 12 months. Offsetting this, it had ₹549.3m in cash and ₹14.6b in receivables that were due within 12 months. So its liabilities total ₹1.84b more than the combination of its cash and short-term receivables.
Having regard to Sundram Fasteners' size, it seems that its liquid assets are well balanced with its total liabilities. So it's very unlikely that the ₹200.5b company is short on cash, but still worth keeping an eye on the balance sheet.
See our latest analysis for Sundram Fasteners
In order to size up a company's debt relative to its earnings, we calculate its net debt divided by its earnings before interest, tax, depreciation, and amortization (EBITDA) and its earnings before interest and tax (EBIT) divided by its interest expense (its interest cover). The advantage of this approach is that we take into account both the absolute quantum of debt (with net debt to EBITDA) and the actual interest expenses associated with that debt (with its interest cover ratio).
Sundram Fasteners has a low net debt to EBITDA ratio of only 0.79. And its EBIT easily covers its interest expense, being 21.5 times the size. So you could argue it is no more threatened by its debt than an elephant is by a mouse. The good news is that Sundram Fasteners has increased its EBIT by 6.9% over twelve months, which should ease any concerns about debt repayment. The balance sheet is clearly the area to focus on when you are analysing debt. But it is future earnings, more than anything, that will determine Sundram Fasteners's ability to maintain a healthy balance sheet going forward. So if you want to see what the professionals think, you might find this free report on analyst profit forecasts to be interesting.
Finally, a business needs free cash flow to pay off debt; accounting profits just don't cut it. So the logical step is to look at the proportion of that EBIT that is matched by actual free cash flow. Looking at the most recent three years, Sundram Fasteners recorded free cash flow of 22% of its EBIT, which is weaker than we'd expect. That's not great, when it comes to paying down debt.
Our View
Sundram Fasteners's interest cover suggests it can handle its debt as easily as Cristiano Ronaldo could score a goal against an under 14's goalkeeper. But truth be told we feel its conversion of EBIT to free cash flow does undermine this impression a bit. All these things considered, it appears that Sundram Fasteners can comfortably handle its current debt levels. On the plus side, this leverage can boost shareholder returns, but the potential downside is more risk of loss, so it's worth monitoring the balance sheet. The balance sheet is clearly the area to focus on when you are analysing debt. However, not all investment risk resides within the balance sheet - far from it. These risks can be hard to spot. Every company has them, and we've spotted 1 warning sign for Sundram Fasteners you should know about.
If, after all that, you're more interested in a fast growing company with a rock-solid balance sheet, then check out our list of net cash growth stocks without delay.
New: Manage All Your Stock Portfolios in One Place
We've created the ultimate portfolio companion for stock investors, and it's free.
• Connect an unlimited number of Portfolios and see your total in one currency
• Be alerted to new Warning Signs or Risks via email or mobile
• Track the Fair Value of your stocks
Have feedback on this article? Concerned about the content? Get in touch with us directly. Alternatively, email editorial-team (at) simplywallst.com.
This article by Simply Wall St is general in nature. We provide commentary based on historical data and analyst forecasts only using an unbiased methodology and our articles are not intended to be financial advice. It does not constitute a recommendation to buy or sell any stock, and does not take account of your objectives, or your financial situation. We aim to bring you long-term focused analysis driven by fundamental data. Note that our analysis may not factor in the latest price-sensitive company announcements or qualitative material. Simply Wall St has no position in any stocks mentioned.
About NSEI:SUNDRMFAST
Sundram Fasteners
Manufactures and sells components for the automotive, infrastructure, wind energy, aerospace, defense, farm equipment, industrial, aviation, and other sectors in India, China, the Americas, and internationally.
Flawless balance sheet average dividend payer.
Market Insights

Advertisement
Community Narratives
MicroVision will explode future revenue by 380.37% with a vision towards success
Fair Value US$60|98.4% undervalued
TH
Community Contributor
The Indispensable Artery for a New North American Economy
Fair Value CA$132.87|0.8% undervalued
TI
Community Contributor
Recently Updated Narratives
RE

RecMag on Proximus ·
Proximus: The State-Backed Backup Plan with 7% Gross Yield and 15% Currency Upside.
Fair Value:€17.1359.3% undervalued
29 followersusers have followed this narrative
0 commentsusers have commented on this narrative
0 likesusers have liked this narrative
SW

swift11 on DXC Technology ·
CEO: We are winners in the long term in the AI world
Fair Value:US$17.4624.9% undervalued
1 followerusers have followed this narrative
0 commentsusers have commented on this narrative
0 likesusers have liked this narrative
AL

AlexLovell on Rocket Lab ·
Early mover in a fast growing industry. Likely to experience share price volatility as they scale
Fair Value:US$16.25158.0% overvalued
2 followersusers have followed this narrative
0 commentsusers have commented on this narrative
0 likesusers have liked this narrative
Popular Narratives
TH

TheWallstreetKing on MicroVision ·
MicroVision will explode future revenue by 380.37% with a vision towards success
Fair Value:US$6098.4% undervalued
99 followersusers have followed this narrative
10 commentsusers have commented on this narrative
19 likesusers have liked this narrative
OS


oscargarcia on Alphabet ·
The company that turned a verb into a global necessity and basically runs the modern internet, digital ads, smartphones, maps, and AI.
Fair Value:US$3405.9% undervalued
137 followersusers have followed this narrative
6 commentsusers have commented on this narrative
18 likesusers have liked this narrative
AN


AnalystConsensusTarget on NVIDIA ·
NVDA: Expanding AI Demand Will Drive Major Data Center Investments Through 2026
Fair Value:US$232.7922.6% undervalued
929 followersusers have followed this narrative
6 commentsusers have commented on this narrative
22 likesusers have liked this narrative