
Advertisement
What trends should we look for it we want to identify stocks that can multiply in value over the long term? In a perfect world, we'd like to see a company investing more capital into its business and ideally the returns earned from that capital are also increasing. Basically this means that a company has profitable initiatives that it can continue to reinvest in, which is a trait of a compounding machine. So, when we ran our eye over Rane (Madras)'s (NSE:RML) trend of ROCE, we liked what we saw.
What Is Return On Capital Employed (ROCE)?
For those that aren't sure what ROCE is, it measures the amount of pre-tax profits a company can generate from the capital employed in its business. To calculate this metric for Rane (Madras), this is the formula:
Return on Capital Employed = Earnings Before Interest and Tax (EBIT) ÷ (Total Assets - Current Liabilities)
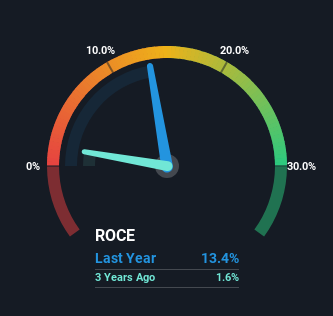
0.13 = ₹688m ÷ (₹13b - ₹8.1b) (Based on the trailing twelve months to December 2022).
Therefore, Rane (Madras) has an ROCE of 13%. That's a pretty standard return and it's in line with the industry average of 13%.
See our latest analysis for Rane (Madras)
While the past is not representative of the future, it can be helpful to know how a company has performed historically, which is why we have this chart above. If you're interested in investigating Rane (Madras)'s past further, check out this free graph of past earnings, revenue and cash flow.
What Can We Tell From Rane (Madras)'s ROCE Trend?
The trend of ROCE doesn't stand out much, but returns on a whole are decent. The company has consistently earned 13% for the last five years, and the capital employed within the business has risen 43% in that time. Since 13% is a moderate ROCE though, it's good to see a business can continue to reinvest at these decent rates of return. Over long periods of time, returns like these might not be too exciting, but with consistency they can pay off in terms of share price returns.
On a separate but related note, it's important to know that Rane (Madras) has a current liabilities to total assets ratio of 61%, which we'd consider pretty high. This can bring about some risks because the company is basically operating with a rather large reliance on its suppliers or other sorts of short-term creditors. While it's not necessarily a bad thing, it can be beneficial if this ratio is lower.
The Bottom Line On Rane (Madras)'s ROCE
The main thing to remember is that Rane (Madras) has proven its ability to continually reinvest at respectable rates of return. However, over the last five years, the stock has only delivered a 15% return to shareholders who held over that period. So because of the trends we're seeing, we'd recommend looking further into this stock to see if it has the makings of a multi-bagger.
Rane (Madras) does come with some risks though, we found 2 warning signs in our investment analysis, and 1 of those doesn't sit too well with us...
For those who like to invest in solid companies, check out this free list of companies with solid balance sheets and high returns on equity.
New: AI Stock Screener & Alerts
Our new AI Stock Screener scans the market every day to uncover opportunities.
• Dividend Powerhouses (3%+ Yield)
• Undervalued Small Caps with Insider Buying
• High growth Tech and AI Companies
Or build your own from over 50 metrics.
Have feedback on this article? Concerned about the content? Get in touch with us directly. Alternatively, email editorial-team (at) simplywallst.com.
This article by Simply Wall St is general in nature. We provide commentary based on historical data and analyst forecasts only using an unbiased methodology and our articles are not intended to be financial advice. It does not constitute a recommendation to buy or sell any stock, and does not take account of your objectives, or your financial situation. We aim to bring you long-term focused analysis driven by fundamental data. Note that our analysis may not factor in the latest price-sensitive company announcements or qualitative material. Simply Wall St has no position in any stocks mentioned.
About NSEI:RML
Rane (Madras)
Engages in the manufacture and marketing of auto components for transportation industry in India and internationally.
Proven track record with adequate balance sheet and pays a dividend.
Market Insights

Advertisement
Community Narratives
MINISO's fair value is projected at 26.69 with an anticipated PE ratio shift of 20x
Fair Value US$24.03|11.0% undervalued
BE
Community Contributor
Procter & Gamble: A Dividend Giant Facing Slowing Growth
Fair Value US$119.81|23.3% overvalued
AN
Community Contributor
Eli Lilly's Future Growth Driven by Tirzepatide and Favorable Market Conditions
Fair Value US$1.19k|13.8% undervalued
EA
Community Contributor