
Advertisement
- India
- /
- Auto Components
- /
- NSEI:PRECAM
Precision Camshafts (NSE:PRECAM) shareholders notch a 192% return over 1 year, yet earnings have been shrinking
The most you can lose on any stock (assuming you don't use leverage) is 100% of your money. On the other hand, if you find a high quality business to buy (at the right price) you can more than double your money! For example, the Precision Camshafts Limited (NSE:PRECAM) share price has soared 189% return in just a single year. Also pleasing for shareholders was the 46% gain in the last three months. Also impressive, the stock is up 72% over three years, making long term shareholders happy, too.
Since the stock has added ₹1.3b to its market cap in the past week alone, let's see if underlying performance has been driving long-term returns.
Check out our latest analysis for Precision Camshafts
While Precision Camshafts made a small profit, in the last year, we think that the market is probably more focussed on the top line growth at the moment. Generally speaking, we'd consider a stock like this alongside loss-making companies, simply because the quantum of the profit is so low. For shareholders to have confidence a company will grow profits significantly, it must grow revenue.
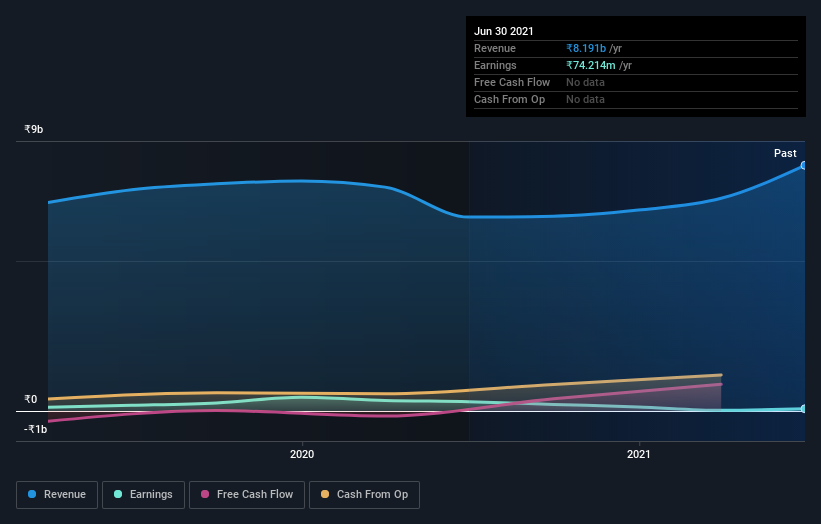
Precision Camshafts grew its revenue by 27% last year. We respect that sort of growth, no doubt. The revenue growth is decent but the share price had an even better year, gaining 189%. Given that the business has made good progress on the top line, it would be worth taking a look at its path to profitability. But investors need to be wary of how the 'fear of missing out' could influence them to buy without doing thorough research.
The company's revenue and earnings (over time) are depicted in the image below (click to see the exact numbers).
Take a more thorough look at Precision Camshafts' financial health with this free report on its balance sheet.
What About Dividends?
When looking at investment returns, it is important to consider the difference between total shareholder return (TSR) and share price return. Whereas the share price return only reflects the change in the share price, the TSR includes the value of dividends (assuming they were reinvested) and the benefit of any discounted capital raising or spin-off. So for companies that pay a generous dividend, the TSR is often a lot higher than the share price return. In the case of Precision Camshafts, it has a TSR of 192% for the last 1 year. That exceeds its share price return that we previously mentioned. This is largely a result of its dividend payments!
A Different Perspective
It's nice to see that Precision Camshafts shareholders have received a total shareholder return of 192% over the last year. That's including the dividend. Notably the five-year annualised TSR loss of 5% per year compares very unfavourably with the recent share price performance. This makes us a little wary, but the business might have turned around its fortunes. I find it very interesting to look at share price over the long term as a proxy for business performance. But to truly gain insight, we need to consider other information, too. Even so, be aware that Precision Camshafts is showing 5 warning signs in our investment analysis , and 1 of those doesn't sit too well with us...
If you would prefer to check out another company -- one with potentially superior financials -- then do not miss this free list of companies that have proven they can grow earnings.
Please note, the market returns quoted in this article reflect the market weighted average returns of stocks that currently trade on IN exchanges.
If you decide to trade Precision Camshafts, use the lowest-cost* platform that is rated #1 Overall by Barron’s, Interactive Brokers. Trade stocks, options, futures, forex, bonds and funds on 135 markets, all from a single integrated account. Promoted
New: Manage All Your Stock Portfolios in One Place
We've created the ultimate portfolio companion for stock investors, and it's free.
• Connect an unlimited number of Portfolios and see your total in one currency
• Be alerted to new Warning Signs or Risks via email or mobile
• Track the Fair Value of your stocks
This article by Simply Wall St is general in nature. We provide commentary based on historical data and analyst forecasts only using an unbiased methodology and our articles are not intended to be financial advice. It does not constitute a recommendation to buy or sell any stock, and does not take account of your objectives, or your financial situation. We aim to bring you long-term focused analysis driven by fundamental data. Note that our analysis may not factor in the latest price-sensitive company announcements or qualitative material. Simply Wall St has no position in any stocks mentioned.
*Interactive Brokers Rated Lowest Cost Broker by StockBrokers.com Annual Online Review 2020
Have feedback on this article? Concerned about the content? Get in touch with us directly. Alternatively, email editorial-team (at) simplywallst.com.
About NSEI:PRECAM
Precision Camshafts
Engages in the manufacture and sale of castings and machined camshafts for the automobile industry in India, Asia, Europe, and internationally.
Flawless balance sheet with proven track record and pays a dividend.
Market Insights

Advertisement
Community Narratives
The company that turned a verb into a global necessity and basically runs the modern internet, digital ads, smartphones, maps, and AI.
Fair Value US$300.00|7.1% undervalued
OS
Community Contributor
Flowers Foods Pays A Fair Price For Health
Fair Value US$16.12|26.4% undervalued
NV
Community Contributor
TMX Group will thrive with 33.3% profit margin and enduring market moat
Fair Value CA$49.90|0.8% overvalued
LI
Community Contributor
The "Molecular Pencil": Why Beam's Technology is Built to Win
Fair Value US$65.01|65.8% undervalued
DA
Community Contributor