Those who invested in Mahindra & Mahindra (NSE:M&M) five years ago are up 410%

Buying shares in the best businesses can build meaningful wealth for you and your family. And we've seen some truly amazing gains over the years. Just think about the savvy investors who held Mahindra & Mahindra Limited (NSE:M&M) shares for the last five years, while they gained 388%. If that doesn't get you thinking about long term investing, we don't know what will. Meanwhile the share price is 1.8% higher than it was a week ago.
Let's take a look at the underlying fundamentals over the longer term, and see if they've been consistent with shareholders returns.
See our latest analysis for Mahindra & Mahindra
To quote Buffett, 'Ships will sail around the world but the Flat Earth Society will flourish. There will continue to be wide discrepancies between price and value in the marketplace...' One imperfect but simple way to consider how the market perception of a company has shifted is to compare the change in the earnings per share (EPS) with the share price movement.
During five years of share price growth, Mahindra & Mahindra achieved compound earnings per share (EPS) growth of 19% per year. This EPS growth is lower than the 37% average annual increase in the share price. This suggests that market participants hold the company in higher regard, these days. And that's hardly shocking given the track record of growth.
You can see below how EPS has changed over time (discover the exact values by clicking on the image).
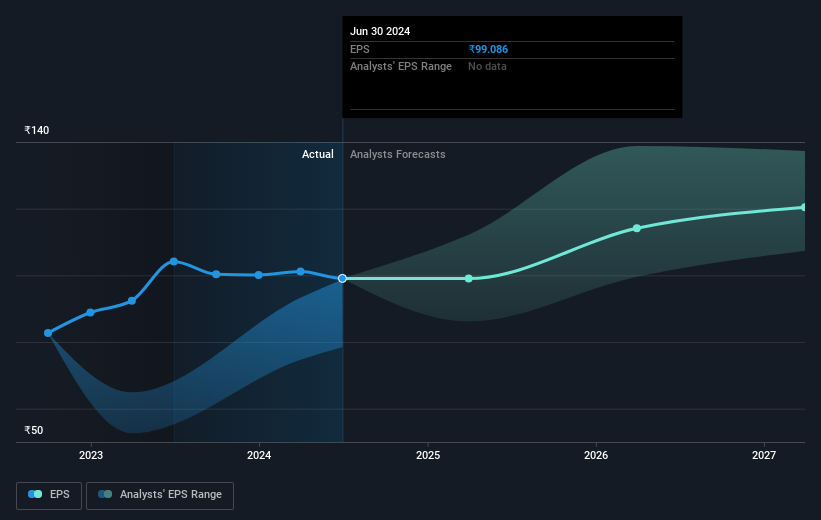
It is of course excellent to see how Mahindra & Mahindra has grown profits over the years, but the future is more important for shareholders. Take a more thorough look at Mahindra & Mahindra's financial health with this free report on its balance sheet.
What About Dividends?
As well as measuring the share price return, investors should also consider the total shareholder return (TSR). Whereas the share price return only reflects the change in the share price, the TSR includes the value of dividends (assuming they were reinvested) and the benefit of any discounted capital raising or spin-off. So for companies that pay a generous dividend, the TSR is often a lot higher than the share price return. We note that for Mahindra & Mahindra the TSR over the last 5 years was 410%, which is better than the share price return mentioned above. This is largely a result of its dividend payments!
A Different Perspective
It's good to see that Mahindra & Mahindra has rewarded shareholders with a total shareholder return of 69% in the last twelve months. That's including the dividend. That gain is better than the annual TSR over five years, which is 39%. Therefore it seems like sentiment around the company has been positive lately. In the best case scenario, this may hint at some real business momentum, implying that now could be a great time to delve deeper. I find it very interesting to look at share price over the long term as a proxy for business performance. But to truly gain insight, we need to consider other information, too. To that end, you should learn about the 3 warning signs we've spotted with Mahindra & Mahindra (including 1 which is a bit unpleasant) .
But note: Mahindra & Mahindra may not be the best stock to buy. So take a peek at this free list of interesting companies with past earnings growth (and further growth forecast).
Please note, the market returns quoted in this article reflect the market weighted average returns of stocks that currently trade on Indian exchanges.
New: Manage All Your Stock Portfolios in One Place
We've created the ultimate portfolio companion for stock investors, and it's free.
• Connect an unlimited number of Portfolios and see your total in one currency
• Be alerted to new Warning Signs or Risks via email or mobile
• Track the Fair Value of your stocks
Have feedback on this article? Concerned about the content? Get in touch with us directly. Alternatively, email editorial-team (at) simplywallst.com.
This article by Simply Wall St is general in nature. We provide commentary based on historical data and analyst forecasts only using an unbiased methodology and our articles are not intended to be financial advice. It does not constitute a recommendation to buy or sell any stock, and does not take account of your objectives, or your financial situation. We aim to bring you long-term focused analysis driven by fundamental data. Note that our analysis may not factor in the latest price-sensitive company announcements or qualitative material. Simply Wall St has no position in any stocks mentioned.
About NSEI:M&M
Mahindra & Mahindra
Provides mobility products and farm solutions in India and internationally.
Mediocre balance sheet second-rate dividend payer.

