
Advertisement
Mahindra & Mahindra (NSE:M&M) jumps 3.9% this week, though earnings growth is still tracking behind five-year shareholder returns
For many, the main point of investing in the stock market is to achieve spectacular returns. And we've seen some truly amazing gains over the years. To wit, the Mahindra & Mahindra Limited (NSE:M&M) share price has soared 433% over five years. This just goes to show the value creation that some businesses can achieve. Also pleasing for shareholders was the 19% gain in the last three months. But this move may well have been assisted by the reasonably buoyant market (up 7.9% in 90 days).
On the back of a solid 7-day performance, let's check what role the company's fundamentals have played in driving long term shareholder returns.
There is no denying that markets are sometimes efficient, but prices do not always reflect underlying business performance. By comparing earnings per share (EPS) and share price changes over time, we can get a feel for how investor attitudes to a company have morphed over time.
Over half a decade, Mahindra & Mahindra managed to grow its earnings per share at 32% a year. This EPS growth is reasonably close to the 40% average annual increase in the share price. Therefore one could conclude that sentiment towards the shares hasn't morphed very much. Rather, the share price has approximately tracked EPS growth.
The company's earnings per share (over time) is depicted in the image below (click to see the exact numbers).
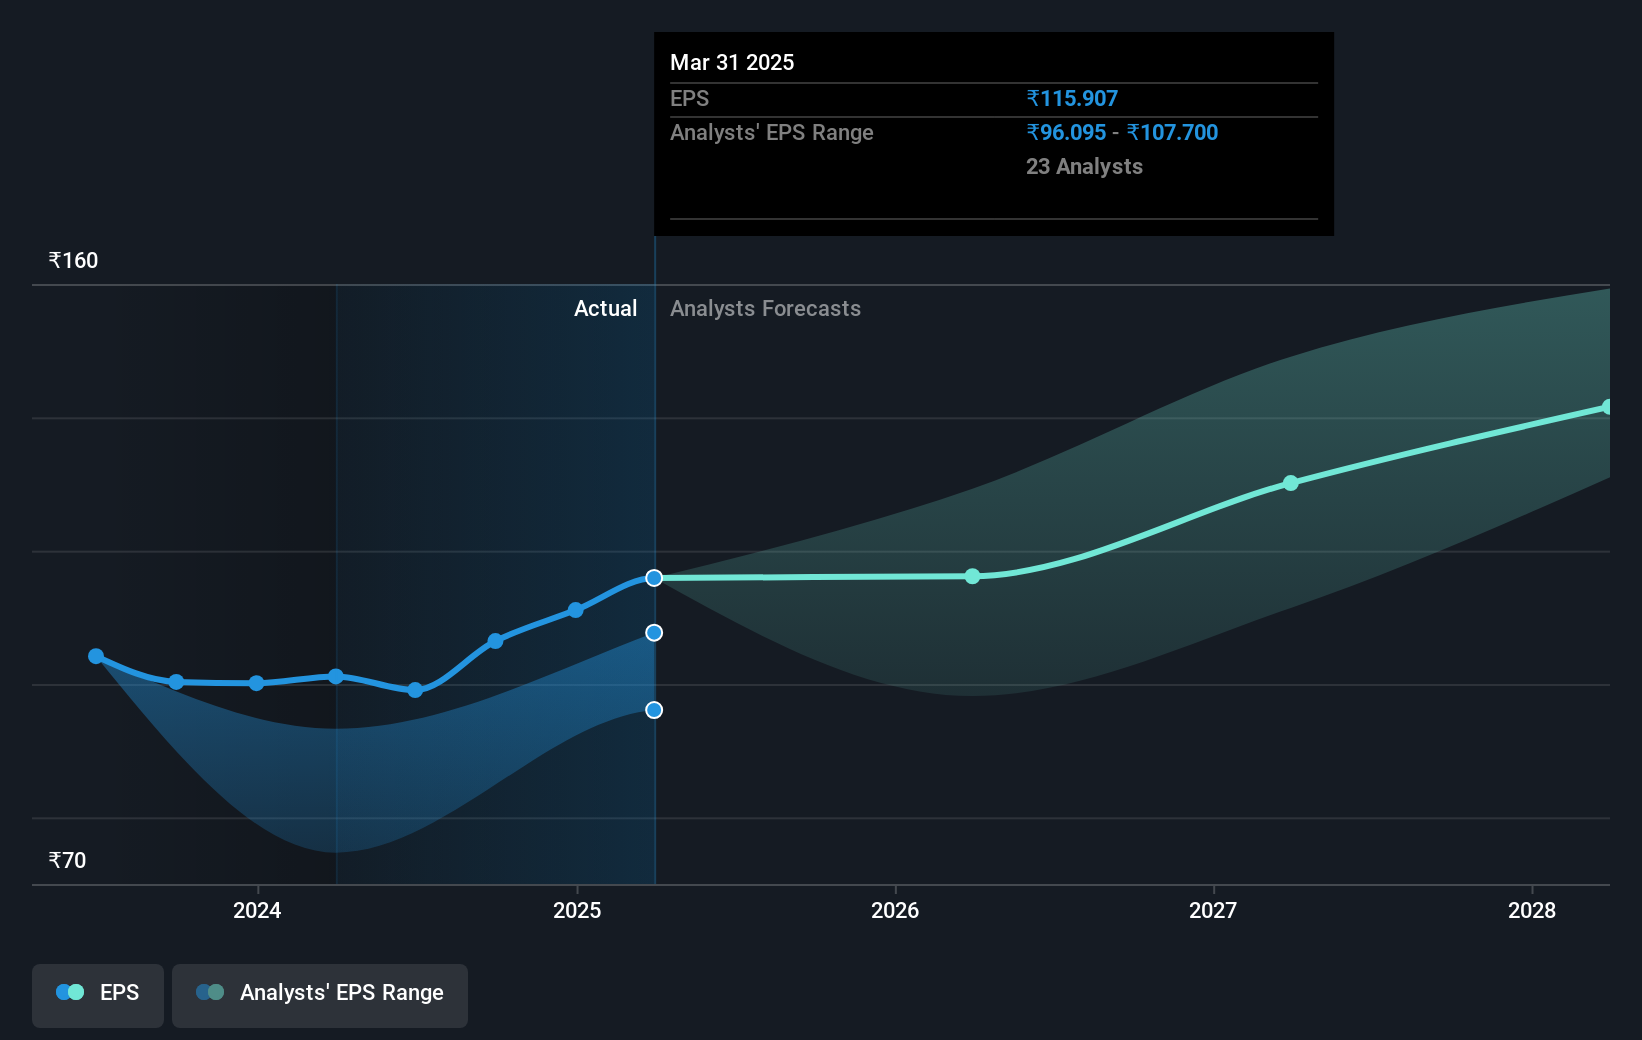
We know that Mahindra & Mahindra has improved its bottom line lately, but is it going to grow revenue? Check if analysts think Mahindra & Mahindra will grow revenue in the future.
What About Dividends?
When looking at investment returns, it is important to consider the difference between total shareholder return (TSR) and share price return. The TSR incorporates the value of any spin-offs or discounted capital raisings, along with any dividends, based on the assumption that the dividends are reinvested. It's fair to say that the TSR gives a more complete picture for stocks that pay a dividend. As it happens, Mahindra & Mahindra's TSR for the last 5 years was 459%, which exceeds the share price return mentioned earlier. And there's no prize for guessing that the dividend payments largely explain the divergence!
A Different Perspective
It's nice to see that Mahindra & Mahindra shareholders have received a total shareholder return of 17% over the last year. That's including the dividend. However, that falls short of the 41% TSR per annum it has made for shareholders, each year, over five years. Potential buyers might understandably feel they've missed the opportunity, but it's always possible business is still firing on all cylinders. While it is well worth considering the different impacts that market conditions can have on the share price, there are other factors that are even more important. Case in point: We've spotted 2 warning signs for Mahindra & Mahindra you should be aware of, and 1 of them is concerning.
Of course Mahindra & Mahindra may not be the best stock to buy. So you may wish to see this free collection of growth stocks.
Please note, the market returns quoted in this article reflect the market weighted average returns of stocks that currently trade on Indian exchanges.
New: Manage All Your Stock Portfolios in One Place
We've created the ultimate portfolio companion for stock investors, and it's free.
• Connect an unlimited number of Portfolios and see your total in one currency
• Be alerted to new Warning Signs or Risks via email or mobile
• Track the Fair Value of your stocks
Have feedback on this article? Concerned about the content? Get in touch with us directly. Alternatively, email editorial-team (at) simplywallst.com.
This article by Simply Wall St is general in nature. We provide commentary based on historical data and analyst forecasts only using an unbiased methodology and our articles are not intended to be financial advice. It does not constitute a recommendation to buy or sell any stock, and does not take account of your objectives, or your financial situation. We aim to bring you long-term focused analysis driven by fundamental data. Note that our analysis may not factor in the latest price-sensitive company announcements or qualitative material. Simply Wall St has no position in any stocks mentioned.
About NSEI:M&M
Mahindra & Mahindra
Provides mobility products and farm solutions in India and internationally.
Adequate balance sheet with acceptable track record.
Similar Companies
Market Insights

Advertisement
Community Narratives
MicroStrategy: Volatile Gamble or Golden Opportunity?
Fair Value US$663.00|35.7% undervalued
BL
Community Contributor
Emerging Markets and Debt Reduction Will Propel Bath & Body Works Forward
Fair Value US$40.73|20.5% undervalued
ZW
Community Contributor
An amazing opportunity to potentially get a 100 bagger
Fair Value US$10.00|25.2% overvalued
DA
Community Contributor