
Advertisement
- India
- /
- Auto Components
- /
- NSEI:KALYANIFRG
Kalyani Forge (NSE:KALYANIFRG) Could Be Struggling To Allocate Capital
If you're looking at a mature business that's past the growth phase, what are some of the underlying trends that pop up? More often than not, we'll see a declining return on capital employed (ROCE) and a declining amount of capital employed. This indicates to us that the business is not only shrinking the size of its net assets, but its returns are falling as well. So after we looked into Kalyani Forge (NSE:KALYANIFRG), the trends above didn't look too great.
Return On Capital Employed (ROCE): What Is It?
Just to clarify if you're unsure, ROCE is a metric for evaluating how much pre-tax income (in percentage terms) a company earns on the capital invested in its business. The formula for this calculation on Kalyani Forge is:
Return on Capital Employed = Earnings Before Interest and Tax (EBIT) ÷ (Total Assets - Current Liabilities)
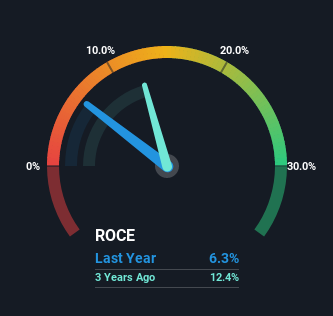
0.063 = ₹69m ÷ (₹1.8b - ₹740m) (Based on the trailing twelve months to June 2022).
Thus, Kalyani Forge has an ROCE of 6.3%. In absolute terms, that's a low return and it also under-performs the Auto Components industry average of 12%.
See our latest analysis for Kalyani Forge
While the past is not representative of the future, it can be helpful to know how a company has performed historically, which is why we have this chart above. If you want to delve into the historical earnings, revenue and cash flow of Kalyani Forge, check out these free graphs here.
The Trend Of ROCE
In terms of Kalyani Forge's historical ROCE movements, the trend doesn't inspire confidence. Unfortunately the returns on capital have diminished from the 8.6% that they were earning five years ago. And on the capital employed front, the business is utilizing roughly the same amount of capital as it was back then. Companies that exhibit these attributes tend to not be shrinking, but they can be mature and facing pressure on their margins from competition. If these trends continue, we wouldn't expect Kalyani Forge to turn into a multi-bagger.
On a separate but related note, it's important to know that Kalyani Forge has a current liabilities to total assets ratio of 40%, which we'd consider pretty high. This effectively means that suppliers (or short-term creditors) are funding a large portion of the business, so just be aware that this can introduce some elements of risk. While it's not necessarily a bad thing, it can be beneficial if this ratio is lower.
The Key Takeaway
In summary, it's unfortunate that Kalyani Forge is generating lower returns from the same amount of capital. It should come as no surprise then that the stock has fallen 31% over the last five years, so it looks like investors are recognizing these changes. That being the case, unless the underlying trends revert to a more positive trajectory, we'd consider looking elsewhere.
One final note, you should learn about the 3 warning signs we've spotted with Kalyani Forge (including 2 which are a bit unpleasant) .
If you want to search for solid companies with great earnings, check out this free list of companies with good balance sheets and impressive returns on equity.
Valuation is complex, but we're here to simplify it.
Discover if Kalyani Forge might be undervalued or overvalued with our detailed analysis, featuring fair value estimates, potential risks, dividends, insider trades, and its financial condition.
Access Free AnalysisHave feedback on this article? Concerned about the content? Get in touch with us directly. Alternatively, email editorial-team (at) simplywallst.com.
This article by Simply Wall St is general in nature. We provide commentary based on historical data and analyst forecasts only using an unbiased methodology and our articles are not intended to be financial advice. It does not constitute a recommendation to buy or sell any stock, and does not take account of your objectives, or your financial situation. We aim to bring you long-term focused analysis driven by fundamental data. Note that our analysis may not factor in the latest price-sensitive company announcements or qualitative material. Simply Wall St has no position in any stocks mentioned.
About NSEI:KALYANIFRG
Kalyani Forge
An engineering company, manufactures and sells forged, machined, and assembled products in India.
Solid track record with slight risk.
Market Insights

Advertisement
Community Narratives
Finding The True Value Of A Logistics Powerhouse
Fair Value US$95.21|8.5% undervalued
NV
Community Contributor
Paradigm Biopharmaceuticals Will Lead Osteoarthritis Treatment with Zilosul's FDA Success
Fair Value AU$5.50|91.9% undervalued
AM
Community Contributor
Barrick Mining (ABX:CA): A Gold Hedge against a U.S. Shutdown
Fair Value CA$60.00|26.5% undervalued
GM
Community Contributor