
Advertisement
- India
- /
- Auto Components
- /
- NSEI:KALYANIFRG
Be Wary Of Kalyani Forge (NSE:KALYANIFRG) And Its Returns On Capital
When it comes to investing, there are some useful financial metrics that can warn us when a business is potentially in trouble. Typically, we'll see the trend of both return on capital employed (ROCE) declining and this usually coincides with a decreasing amount of capital employed. Basically the company is earning less on its investments and it is also reducing its total assets. So after glancing at the trends within Kalyani Forge (NSE:KALYANIFRG), we weren't too hopeful.
Understanding Return On Capital Employed (ROCE)
For those that aren't sure what ROCE is, it measures the amount of pre-tax profits a company can generate from the capital employed in its business. To calculate this metric for Kalyani Forge, this is the formula:
Return on Capital Employed = Earnings Before Interest and Tax (EBIT) ÷ (Total Assets - Current Liabilities)
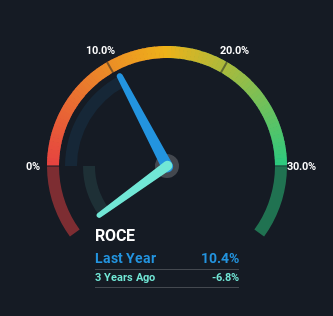
0.10 = ₹117m ÷ (₹2.1b - ₹928m) (Based on the trailing twelve months to June 2023).
Therefore, Kalyani Forge has an ROCE of 10%. In isolation, that's a pretty standard return but against the Auto Components industry average of 14%, it's not as good.
View our latest analysis for Kalyani Forge
While the past is not representative of the future, it can be helpful to know how a company has performed historically, which is why we have this chart above. If you'd like to look at how Kalyani Forge has performed in the past in other metrics, you can view this free graph of past earnings, revenue and cash flow.
What Does the ROCE Trend For Kalyani Forge Tell Us?
In terms of Kalyani Forge's historical ROCE movements, the trend doesn't inspire confidence. To be more specific, the ROCE was 14% five years ago, but since then it has dropped noticeably. On top of that, it's worth noting that the amount of capital employed within the business has remained relatively steady. Since returns are falling and the business has the same amount of assets employed, this can suggest it's a mature business that hasn't had much growth in the last five years. If these trends continue, we wouldn't expect Kalyani Forge to turn into a multi-bagger.
Another thing to note, Kalyani Forge has a high ratio of current liabilities to total assets of 45%. This effectively means that suppliers (or short-term creditors) are funding a large portion of the business, so just be aware that this can introduce some elements of risk. While it's not necessarily a bad thing, it can be beneficial if this ratio is lower.
What We Can Learn From Kalyani Forge's ROCE
In the end, the trend of lower returns on the same amount of capital isn't typically an indication that we're looking at a growth stock. Investors must expect better things on the horizon though because the stock has risen 33% in the last five years. Either way, we aren't huge fans of the current trends and so with that we think you might find better investments elsewhere.
On a final note, we found 4 warning signs for Kalyani Forge (1 is concerning) you should be aware of.
While Kalyani Forge isn't earning the highest return, check out this free list of companies that are earning high returns on equity with solid balance sheets.
Valuation is complex, but we're here to simplify it.
Discover if Kalyani Forge might be undervalued or overvalued with our detailed analysis, featuring fair value estimates, potential risks, dividends, insider trades, and its financial condition.
Access Free AnalysisHave feedback on this article? Concerned about the content? Get in touch with us directly. Alternatively, email editorial-team (at) simplywallst.com.
This article by Simply Wall St is general in nature. We provide commentary based on historical data and analyst forecasts only using an unbiased methodology and our articles are not intended to be financial advice. It does not constitute a recommendation to buy or sell any stock, and does not take account of your objectives, or your financial situation. We aim to bring you long-term focused analysis driven by fundamental data. Note that our analysis may not factor in the latest price-sensitive company announcements or qualitative material. Simply Wall St has no position in any stocks mentioned.
About NSEI:KALYANIFRG
Kalyani Forge
An engineering company, manufactures and sells forged, machined, and assembled products in India.
Solid track record with slight risk.
Market Insights

Advertisement
Community Narratives
Finding The True Value Of A Logistics Powerhouse
Fair Value US$95.21|8.5% undervalued
NV
Community Contributor
Paradigm Biopharmaceuticals Will Lead Osteoarthritis Treatment with Zilosul's FDA Success
Fair Value AU$5.50|91.8% undervalued
AM
Community Contributor
Barrick Mining (ABX:CA): A Gold Hedge against a U.S. Shutdown
Fair Value CA$60.00|26.5% undervalued
GM
Community Contributor