
Advertisement
- India
- /
- Auto Components
- /
- NSEI:FIEMIND
Has Fiem Industries Limited's (NSE:FIEMIND) Impressive Stock Performance Got Anything to Do With Its Fundamentals?
Fiem Industries' (NSE:FIEMIND) stock is up by a considerable 19% over the past month. Given that stock prices are usually aligned with a company's financial performance in the long-term, we decided to study its financial indicators more closely to see if they had a hand to play in the recent price move. Specifically, we decided to study Fiem Industries' ROE in this article.
Return on Equity or ROE is a test of how effectively a company is growing its value and managing investors’ money. Simply put, it is used to assess the profitability of a company in relation to its equity capital.
See our latest analysis for Fiem Industries
How Do You Calculate Return On Equity?
The formula for ROE is:
Return on Equity = Net Profit (from continuing operations) ÷ Shareholders' Equity
So, based on the above formula, the ROE for Fiem Industries is:
8.8% = ₹456m ÷ ₹5.2b (Based on the trailing twelve months to September 2020).
The 'return' refers to a company's earnings over the last year. So, this means that for every ₹1 of its shareholder's investments, the company generates a profit of ₹0.09.
Why Is ROE Important For Earnings Growth?
Thus far, we have learned that ROE measures how efficiently a company is generating its profits. Depending on how much of these profits the company reinvests or "retains", and how effectively it does so, we are then able to assess a company’s earnings growth potential. Assuming all else is equal, companies that have both a higher return on equity and higher profit retention are usually the ones that have a higher growth rate when compared to companies that don't have the same features.
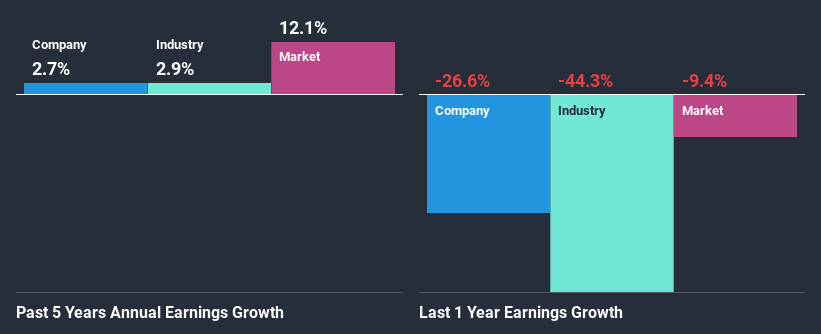
A Side By Side comparison of Fiem Industries' Earnings Growth And 8.8% ROE
As you can see, Fiem Industries' ROE looks pretty weak. However, the fact that it is higher than the industry average of 5.6% makes us a bit more interested. Still, Fiem Industries has seen very little net income growth of 2.7% over the past five years. Remember, the company's ROE is quite low to begin with, just that it is higher than the industry average. Hence, this goes some way in explaining the low earnings growth.
We then performed a comparison between Fiem Industries' net income growth with the industry, which revealed that the company's growth is similar to the average industry growth of 2.9% in the same period.
Earnings growth is a huge factor in stock valuation. What investors need to determine next is if the expected earnings growth, or the lack of it, is already built into the share price. Doing so will help them establish if the stock's future looks promising or ominous. One good indicator of expected earnings growth is the P/E ratio which determines the price the market is willing to pay for a stock based on its earnings prospects. So, you may want to check if Fiem Industries is trading on a high P/E or a low P/E, relative to its industry.
Is Fiem Industries Using Its Retained Earnings Effectively?
Fiem Industries' low three-year median payout ratio of 23% (or a retention ratio of 77%) should mean that the company is retaining most of its earnings to fuel its growth. However, the low earnings growth number doesn't reflect this fact. Therefore, there might be some other reasons to explain the lack in that respect. For example, the business could be in decline.
Additionally, Fiem Industries has paid dividends over a period of at least ten years, which means that the company's management is determined to pay dividends even if it means little to no earnings growth.
Conclusion
In total, it does look like Fiem Industries has some positive aspects to its business. Particularly, its earnings have grown respectably as we saw earlier, which was likely achieved due to the company reinvesting most of its earnings at a decent rate of return, to grow its business. While we won't completely dismiss the company, what we would do, is try to ascertain how risky the business is to make a more informed decision around the company. To know the 1 risk we have identified for Fiem Industries visit our risks dashboard for free.
If you’re looking to trade Fiem Industries, open an account with the lowest-cost* platform trusted by professionals, Interactive Brokers. Their clients from over 200 countries and territories trade stocks, options, futures, forex, bonds and funds worldwide from a single integrated account. Promoted
New: AI Stock Screener & Alerts
Our new AI Stock Screener scans the market every day to uncover opportunities.
• Dividend Powerhouses (3%+ Yield)
• Undervalued Small Caps with Insider Buying
• High growth Tech and AI Companies
Or build your own from over 50 metrics.
This article by Simply Wall St is general in nature. It does not constitute a recommendation to buy or sell any stock, and does not take account of your objectives, or your financial situation. We aim to bring you long-term focused analysis driven by fundamental data. Note that our analysis may not factor in the latest price-sensitive company announcements or qualitative material. Simply Wall St has no position in any stocks mentioned.
*Interactive Brokers Rated Lowest Cost Broker by StockBrokers.com Annual Online Review 2020
Have feedback on this article? Concerned about the content? Get in touch with us directly. Alternatively, email editorial-team (at) simplywallst.com.
About NSEI:FIEMIND
Fiem Industries
Manufactures and supplies automotive lighting and signaling equipment, rear view mirrors, prismatic mirror, plastic moulded parts, bank angle sensor, canister, and sheet metal components for motorized vehicles in India and internationally.
Flawless balance sheet with solid track record and pays a dividend.
Market Insights

Advertisement
Community Narratives
MicroVision will explode future revenue by 380.37% with a vision towards success
Fair Value US$60|98.4% undervalued
TH
Community Contributor
The Indispensable Artery for a New North American Economy
Fair Value CA$132.87|0.6% undervalued
TI
Community Contributor
Recently Updated Narratives
MA


MarkoVT on COVER ·
Q3 Outlook modestly optimistic
Fair Value:JP¥1.65k2.0% overvalued
1 followerusers have followed this narrative
0 commentsusers have commented on this narrative
0 likesusers have liked this narrative
BL


BlackGoat on Alphabet ·
Alphabet: The Under-appreciated Compounder Hiding in Plain Sight
Fair Value:US$324.481.3% undervalued
77 followersusers have followed this narrative
3 commentsusers have commented on this narrative
1 likeusers have liked this narrative
BE


Bejgal on MINISO Group Holding ·
MINISO's fair value is projected at 26.69 with an anticipated PE ratio shift of 20x
Fair Value:US$26.6926.7% undervalued
46 followersusers have followed this narrative
3 commentsusers have commented on this narrative
0 likesusers have liked this narrative
Popular Narratives
OS

oscargarcia on Alphabet ·
The company that turned a verb into a global necessity and basically runs the modern internet, digital ads, smartphones, maps, and AI.
Fair Value:US$3405.9% undervalued
136 followersusers have followed this narrative
6 commentsusers have commented on this narrative
18 likesusers have liked this narrative
TH

TheWallstreetKing on MicroVision ·
MicroVision will explode future revenue by 380.37% with a vision towards success
Fair Value:US$6098.4% undervalued
91 followersusers have followed this narrative
10 commentsusers have commented on this narrative
18 likesusers have liked this narrative
AN


AnalystConsensusTarget on NVIDIA ·
NVDA: Expanding AI Demand Will Drive Major Data Center Investments Through 2026
Fair Value:US$232.7922.6% undervalued
928 followersusers have followed this narrative
6 commentsusers have commented on this narrative
22 likesusers have liked this narrative