
Advertisement
Warren Buffett famously said, 'Volatility is far from synonymous with risk.' So it seems the smart money knows that debt - which is usually involved in bankruptcies - is a very important factor, when you assess how risky a company is. As with many other companies CEAT Limited (NSE:CEATLTD) makes use of debt. But the more important question is: how much risk is that debt creating?
Why Does Debt Bring Risk?
Debt is a tool to help businesses grow, but if a business is incapable of paying off its lenders, then it exists at their mercy. Ultimately, if the company can't fulfill its legal obligations to repay debt, shareholders could walk away with nothing. However, a more frequent (but still costly) occurrence is where a company must issue shares at bargain-basement prices, permanently diluting shareholders, just to shore up its balance sheet. By replacing dilution, though, debt can be an extremely good tool for businesses that need capital to invest in growth at high rates of return. When we examine debt levels, we first consider both cash and debt levels, together.
View our latest analysis for CEAT
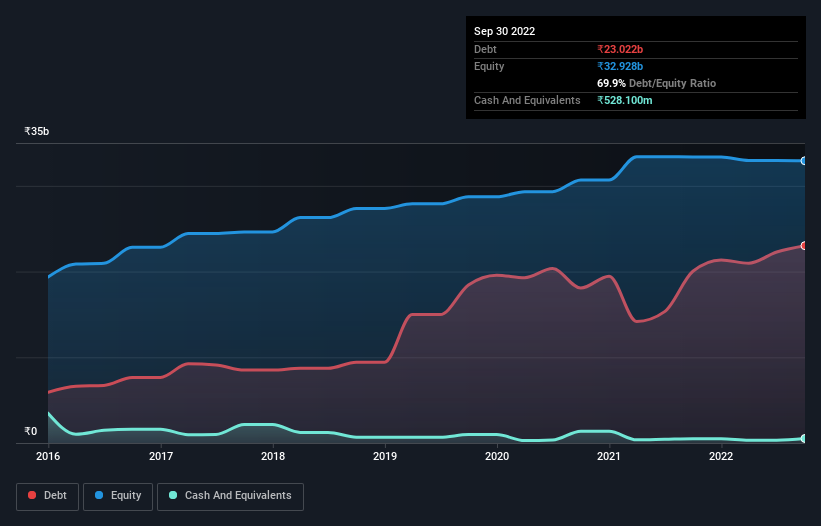
What Is CEAT's Net Debt?
As you can see below, at the end of September 2022, CEAT had ₹23.0b of debt, up from ₹20.0b a year ago. Click the image for more detail. However, it does have ₹528.1m in cash offsetting this, leading to net debt of about ₹22.5b.
How Strong Is CEAT's Balance Sheet?
We can see from the most recent balance sheet that CEAT had liabilities of ₹42.0b falling due within a year, and liabilities of ₹22.1b due beyond that. On the other hand, it had cash of ₹528.1m and ₹12.3b worth of receivables due within a year. So its liabilities outweigh the sum of its cash and (near-term) receivables by ₹51.3b.
This is a mountain of leverage relative to its market capitalization of ₹67.1b. This suggests shareholders would be heavily diluted if the company needed to shore up its balance sheet in a hurry.
We measure a company's debt load relative to its earnings power by looking at its net debt divided by its earnings before interest, tax, depreciation, and amortization (EBITDA) and by calculating how easily its earnings before interest and tax (EBIT) cover its interest expense (interest cover). This way, we consider both the absolute quantum of the debt, as well as the interest rates paid on it.
While CEAT's debt to EBITDA ratio (3.8) suggests that it uses some debt, its interest cover is very weak, at 1.2, suggesting high leverage. It seems that the business incurs large depreciation and amortisation charges, so maybe its debt load is heavier than it would first appear, since EBITDA is arguably a generous measure of earnings. It seems clear that the cost of borrowing money is negatively impacting returns for shareholders, of late. Even worse, CEAT saw its EBIT tank 56% over the last 12 months. If earnings keep going like that over the long term, it has a snowball's chance in hell of paying off that debt. When analysing debt levels, the balance sheet is the obvious place to start. But it is future earnings, more than anything, that will determine CEAT's ability to maintain a healthy balance sheet going forward. So if you want to see what the professionals think, you might find this free report on analyst profit forecasts to be interesting.
Finally, while the tax-man may adore accounting profits, lenders only accept cold hard cash. So we clearly need to look at whether that EBIT is leading to corresponding free cash flow. Looking at the most recent three years, CEAT recorded free cash flow of 24% of its EBIT, which is weaker than we'd expect. That's not great, when it comes to paying down debt.
Our View
To be frank both CEAT's interest cover and its track record of (not) growing its EBIT make us rather uncomfortable with its debt levels. And even its level of total liabilities fails to inspire much confidence. Overall, it seems to us that CEAT's balance sheet is really quite a risk to the business. So we're almost as wary of this stock as a hungry kitten is about falling into its owner's fish pond: once bitten, twice shy, as they say. When analysing debt levels, the balance sheet is the obvious place to start. However, not all investment risk resides within the balance sheet - far from it. We've identified 3 warning signs with CEAT (at least 1 which is concerning) , and understanding them should be part of your investment process.
When all is said and done, sometimes its easier to focus on companies that don't even need debt. Readers can access a list of growth stocks with zero net debt 100% free, right now.
New: AI Stock Screener & Alerts
Our new AI Stock Screener scans the market every day to uncover opportunities.
• Dividend Powerhouses (3%+ Yield)
• Undervalued Small Caps with Insider Buying
• High growth Tech and AI Companies
Or build your own from over 50 metrics.
Have feedback on this article? Concerned about the content? Get in touch with us directly. Alternatively, email editorial-team (at) simplywallst.com.
This article by Simply Wall St is general in nature. We provide commentary based on historical data and analyst forecasts only using an unbiased methodology and our articles are not intended to be financial advice. It does not constitute a recommendation to buy or sell any stock, and does not take account of your objectives, or your financial situation. We aim to bring you long-term focused analysis driven by fundamental data. Note that our analysis may not factor in the latest price-sensitive company announcements or qualitative material. Simply Wall St has no position in any stocks mentioned.
About NSEI:CEATLTD
CEAT
Manufactures and sells automotive tyres, tubes, and flaps in India and internationally.
Reasonable growth potential average dividend payer.
Similar Companies
Market Insights

Advertisement
Community Narratives
The company that turned a verb into a global necessity and basically runs the modern internet, digital ads, smartphones, maps, and AI.
Fair Value US$300.00|10.8% undervalued
OS
Community Contributor
Flowers Foods Pays A Fair Price For Health
Fair Value US$16.12|22.0% undervalued
NV
Community Contributor
TMX Group will thrive with 33.3% profit margin and enduring market moat
Fair Value CA$49.90|3.8% overvalued
LI
Community Contributor