
Advertisement

There are a few key trends to look for if we want to identify the next multi-bagger. Ideally, a business will show two trends; firstly a growing return on capital employed (ROCE) and secondly, an increasing amount of capital employed. Ultimately, this demonstrates that it's a business that is reinvesting profits at increasing rates of return. In light of that, when we looked at Gold Bond Group (TLV:GOLD) and its ROCE trend, we weren't exactly thrilled.
Understanding Return On Capital Employed (ROCE)
For those that aren't sure what ROCE is, it measures the amount of pre-tax profits a company can generate from the capital employed in its business. To calculate this metric for Gold Bond Group, this is the formula:
Return on Capital Employed = Earnings Before Interest and Tax (EBIT) ÷ (Total Assets - Current Liabilities)
0.0086 = ₪6.5m ÷ (₪804m - ₪54m) (Based on the trailing twelve months to September 2020).
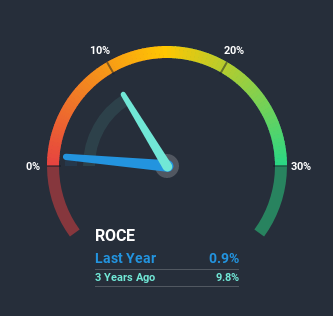
Thus, Gold Bond Group has an ROCE of 0.9%. Ultimately, that's a low return and it under-performs the Infrastructure industry average of 4.7%.
See our latest analysis for Gold Bond Group
While the past is not representative of the future, it can be helpful to know how a company has performed historically, which is why we have this chart above. If you'd like to look at how Gold Bond Group has performed in the past in other metrics, you can view this free graph of past earnings, revenue and cash flow.
So How Is Gold Bond Group's ROCE Trending?
On the surface, the trend of ROCE at Gold Bond Group doesn't inspire confidence. Over the last five years, returns on capital have decreased to 0.9% from 15% five years ago. Meanwhile, the business is utilizing more capital but this hasn't moved the needle much in terms of sales in the past 12 months, so this could reflect longer term investments. It may take some time before the company starts to see any change in earnings from these investments.
In Conclusion...
To conclude, we've found that Gold Bond Group is reinvesting in the business, but returns have been falling. Additionally, the stock's total return to shareholders over the last five years has been flat, which isn't too surprising. On the whole, we aren't too inspired by the underlying trends and we think there may be better chances of finding a multi-bagger elsewhere.
One more thing to note, we've identified 1 warning sign with Gold Bond Group and understanding it should be part of your investment process.
If you want to search for solid companies with great earnings, check out this free list of companies with good balance sheets and impressive returns on equity.
If you’re looking to trade Gold Bond Group, open an account with the lowest-cost* platform trusted by professionals, Interactive Brokers. Their clients from over 200 countries and territories trade stocks, options, futures, forex, bonds and funds worldwide from a single integrated account. Promoted
New: Manage All Your Stock Portfolios in One Place
We've created the ultimate portfolio companion for stock investors, and it's free.
• Connect an unlimited number of Portfolios and see your total in one currency
• Be alerted to new Warning Signs or Risks via email or mobile
• Track the Fair Value of your stocks
This article by Simply Wall St is general in nature. It does not constitute a recommendation to buy or sell any stock, and does not take account of your objectives, or your financial situation. We aim to bring you long-term focused analysis driven by fundamental data. Note that our analysis may not factor in the latest price-sensitive company announcements or qualitative material. Simply Wall St has no position in any stocks mentioned.
*Interactive Brokers Rated Lowest Cost Broker by StockBrokers.com Annual Online Review 2020
Have feedback on this article? Concerned about the content? Get in touch with us directly. Alternatively, email editorial-team (at) simplywallst.com.
About TASE:GOLD
Gold Bond Group
Engages in the storage, conveyance, and logistical solutions for cargoes and containers.
Excellent balance sheet with proven track record.
Market Insights

Advertisement
Community Narratives
Pinterest will surge as advertising innovations ignite revenue growth
Fair Value US$42.63|27.0% undervalued
BR
Community Contributor
Brambles' Revenue Set to Climb 14% with Profit Margins Following
Fair Value AU$21.90|5.9% overvalued
RO
Community Contributor
Challenging Future for STG as Organic Sales Decline by 8.8%
Fair Value DKK 116.13|26.8% undervalued
KA
Community Contributor