- Israel
- /
- Electronic Equipment and Components
- /
- TASE:ININ
Is Inter Industries Plus (TLV:ININ) A Risky Investment?

Warren Buffett famously said, 'Volatility is far from synonymous with risk.' So it might be obvious that you need to consider debt, when you think about how risky any given stock is, because too much debt can sink a company. Importantly, Inter Industries Plus Ltd (TLV:ININ) does carry debt. But is this debt a concern to shareholders?
When Is Debt Dangerous?
Debt is a tool to help businesses grow, but if a business is incapable of paying off its lenders, then it exists at their mercy. If things get really bad, the lenders can take control of the business. However, a more common (but still painful) scenario is that it has to raise new equity capital at a low price, thus permanently diluting shareholders. Of course, debt can be an important tool in businesses, particularly capital heavy businesses. The first thing to do when considering how much debt a business uses is to look at its cash and debt together.
See our latest analysis for Inter Industries Plus
What Is Inter Industries Plus's Debt?
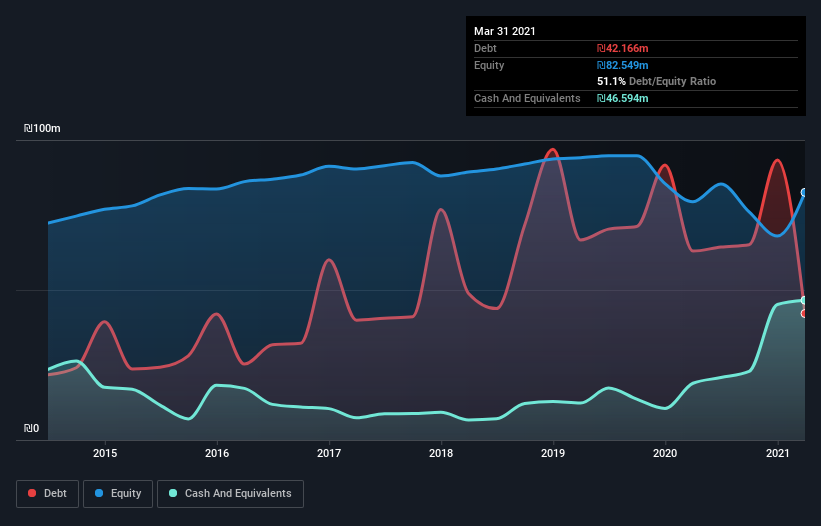
As you can see below, Inter Industries Plus had ₪42.2m of debt at March 2021, down from ₪63.0m a year prior. However, it does have ₪46.6m in cash offsetting this, leading to net cash of ₪4.43m.
How Strong Is Inter Industries Plus' Balance Sheet?
We can see from the most recent balance sheet that Inter Industries Plus had liabilities of ₪194.8m falling due within a year, and liabilities of ₪52.0m due beyond that. Offsetting this, it had ₪46.6m in cash and ₪186.0m in receivables that were due within 12 months. So it has liabilities totalling ₪14.1m more than its cash and near-term receivables, combined.
Given Inter Industries Plus has a market capitalization of ₪154.6m, it's hard to believe these liabilities pose much threat. However, we do think it is worth keeping an eye on its balance sheet strength, as it may change over time. While it does have liabilities worth noting, Inter Industries Plus also has more cash than debt, so we're pretty confident it can manage its debt safely. When analysing debt levels, the balance sheet is the obvious place to start. But it is Inter Industries Plus's earnings that will influence how the balance sheet holds up in the future. So if you're keen to discover more about its earnings, it might be worth checking out this graph of its long term earnings trend.
In the last year Inter Industries Plus wasn't profitable at an EBIT level, but managed to grow its revenue by 9.4%, to ₪354m. We usually like to see faster growth from unprofitable companies, but each to their own.
So How Risky Is Inter Industries Plus?
While Inter Industries Plus lost money on an earnings before interest and tax (EBIT) level, it actually generated positive free cash flow ₪2.7m. So although it is loss-making, it doesn't seem to have too much near-term balance sheet risk, keeping in mind the net cash. Until we see some positive EBIT, we're a bit cautious of the stock, not least because of the rather modest revenue growth. When analysing debt levels, the balance sheet is the obvious place to start. However, not all investment risk resides within the balance sheet - far from it. We've identified 3 warning signs with Inter Industries Plus (at least 2 which don't sit too well with us) , and understanding them should be part of your investment process.
At the end of the day, it's often better to focus on companies that are free from net debt. You can access our special list of such companies (all with a track record of profit growth). It's free.
If you’re looking to trade a wide range of investments, open an account with the lowest-cost* platform trusted by professionals, Interactive Brokers. Their clients from over 200 countries and territories trade stocks, options, futures, forex, bonds and funds worldwide from a single integrated account. Promoted
The New Payments ETF Is Live on NASDAQ:
Money is moving to real-time rails, and a newly listed ETF now gives investors direct exposure. Fast settlement. Institutional custody. Simple access.
Explore how this launch could reshape portfolios
Sponsored ContentNew: AI Stock Screener & Alerts
Our new AI Stock Screener scans the market every day to uncover opportunities.
• Dividend Powerhouses (3%+ Yield)
• Undervalued Small Caps with Insider Buying
• High growth Tech and AI Companies
Or build your own from over 50 metrics.
This article by Simply Wall St is general in nature. It does not constitute a recommendation to buy or sell any stock, and does not take account of your objectives, or your financial situation. We aim to bring you long-term focused analysis driven by fundamental data. Note that our analysis may not factor in the latest price-sensitive company announcements or qualitative material. Simply Wall St has no position in any stocks mentioned.
*Interactive Brokers Rated Lowest Cost Broker by StockBrokers.com Annual Online Review 2020
Have feedback on this article? Concerned about the content? Get in touch with us directly. Alternatively, email editorial-team (at) simplywallst.com.
About TASE:ININ
Inter Industries Plus
Engages in the energy and infrastructure businesses in Israel.
Flawless balance sheet and slightly overvalued.
Similar Companies
Market Insights

Weekly Picks

Early mover in a fast growing industry. Likely to experience share price volatility as they scale


A case for CA$31.80 (undiluted), aka 8,616% upside from CA$0.37 (an 86 bagger!).


Moderation and Stabilisation: HOLD: Fair Price based on a 4-year Cycle is $12.08
Recently Updated Narratives

Airbnb Stock: Platform Growth in a World of Saturation and Scrutiny

Adobe Stock: AI-Fueled ARR Growth Pushes Guidance Higher, But Cost Pressures Loom

Thomson Reuters Stock: When Legal Intelligence Becomes Mission-Critical Infrastructure
Popular Narratives


Crazy Undervalued 42 Baggers Silver Play (Active & Running Mine)


NVDA: Expanding AI Demand Will Drive Major Data Center Investments Through 2026

The AI Infrastructure Giant Grows Into Its Valuation
Trending Discussion


