- Israel
- /
- Specialty Stores
- /
- TASE:GOLF
Subdued Growth No Barrier To Golf & Co Group Ltd (TLV:GOLF) With Shares Advancing 27%


Despite an already strong run, Golf & Co Group Ltd (TLV:GOLF) shares have been powering on, with a gain of 27% in the last thirty days. Unfortunately, the gains of the last month did little to right the losses of the last year with the stock still down 48% over that time.
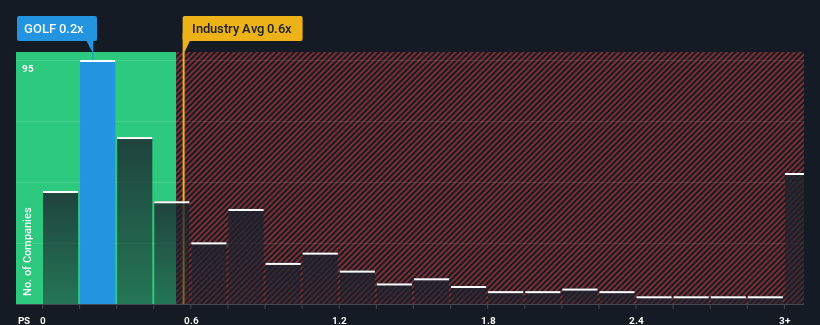
Although its price has surged higher, it's still not a stretch to say that Golf & Co Group's price-to-sales (or "P/S") ratio of 0.2x right now seems quite "middle-of-the-road" compared to the Specialty Retail industry in Israel, where the median P/S ratio is around 0.3x. Although, it's not wise to simply ignore the P/S without explanation as investors may be disregarding a distinct opportunity or a costly mistake.
View our latest analysis for Golf & Co Group
What Does Golf & Co Group's P/S Mean For Shareholders?
For instance, Golf & Co Group's receding revenue in recent times would have to be some food for thought. One possibility is that the P/S is moderate because investors think the company might still do enough to be in line with the broader industry in the near future. If not, then existing shareholders may be a little nervous about the viability of the share price.
Want the full picture on earnings, revenue and cash flow for the company? Then our free report on Golf & Co Group will help you shine a light on its historical performance.How Is Golf & Co Group's Revenue Growth Trending?
There's an inherent assumption that a company should be matching the industry for P/S ratios like Golf & Co Group's to be considered reasonable.
Taking a look back first, the company's revenue growth last year wasn't something to get excited about as it posted a disappointing decline of 11%. At least revenue has managed not to go completely backwards from three years ago in aggregate, thanks to the earlier period of growth. Accordingly, shareholders probably wouldn't have been overly satisfied with the unstable medium-term growth rates.
Comparing the recent medium-term revenue trends against the industry's one-year growth forecast of 13% shows it's noticeably less attractive.
In light of this, it's curious that Golf & Co Group's P/S sits in line with the majority of other companies. Apparently many investors in the company are less bearish than recent times would indicate and aren't willing to let go of their stock right now. They may be setting themselves up for future disappointment if the P/S falls to levels more in line with recent growth rates.
What Does Golf & Co Group's P/S Mean For Investors?
Golf & Co Group's stock has a lot of momentum behind it lately, which has brought its P/S level with the rest of the industry. Using the price-to-sales ratio alone to determine if you should sell your stock isn't sensible, however it can be a practical guide to the company's future prospects.
We've established that Golf & Co Group's average P/S is a bit surprising since its recent three-year growth is lower than the wider industry forecast. Right now we are uncomfortable with the P/S as this revenue performance isn't likely to support a more positive sentiment for long. If recent medium-term revenue trends continue, the probability of a share price decline will become quite substantial, placing shareholders at risk.
There are also other vital risk factors to consider and we've discovered 2 warning signs for Golf & Co Group (1 doesn't sit too well with us!) that you should be aware of before investing here.
If strong companies turning a profit tickle your fancy, then you'll want to check out this free list of interesting companies that trade on a low P/E (but have proven they can grow earnings).
New: Manage All Your Stock Portfolios in One Place
We've created the ultimate portfolio companion for stock investors, and it's free.
• Connect an unlimited number of Portfolios and see your total in one currency
• Be alerted to new Warning Signs or Risks via email or mobile
• Track the Fair Value of your stocks
Have feedback on this article? Concerned about the content? Get in touch with us directly. Alternatively, email editorial-team (at) simplywallst.com.
This article by Simply Wall St is general in nature. We provide commentary based on historical data and analyst forecasts only using an unbiased methodology and our articles are not intended to be financial advice. It does not constitute a recommendation to buy or sell any stock, and does not take account of your objectives, or your financial situation. We aim to bring you long-term focused analysis driven by fundamental data. Note that our analysis may not factor in the latest price-sensitive company announcements or qualitative material. Simply Wall St has no position in any stocks mentioned.
About TASE:GOLF
Golf & Co Group
Operates as a retail company in the field of fashion, home styling, and apparel in Israel.
Excellent balance sheet, good value and pays a dividend.
Similar Companies
Market Insights

Community Narratives

