
Advertisement
Legendary fund manager Li Lu (who Charlie Munger backed) once said, 'The biggest investment risk is not the volatility of prices, but whether you will suffer a permanent loss of capital.' So it seems the smart money knows that debt - which is usually involved in bankruptcies - is a very important factor, when you assess how risky a company is. We note that Kamada Ltd. (TLV:KMDA) does have debt on its balance sheet. But the real question is whether this debt is making the company risky.
When Is Debt Dangerous?
Generally speaking, debt only becomes a real problem when a company can't easily pay it off, either by raising capital or with its own cash flow. Part and parcel of capitalism is the process of 'creative destruction' where failed businesses are mercilessly liquidated by their bankers. However, a more usual (but still expensive) situation is where a company must dilute shareholders at a cheap share price simply to get debt under control. Having said that, the most common situation is where a company manages its debt reasonably well - and to its own advantage. When we examine debt levels, we first consider both cash and debt levels, together.
View our latest analysis for Kamada
What Is Kamada's Debt?
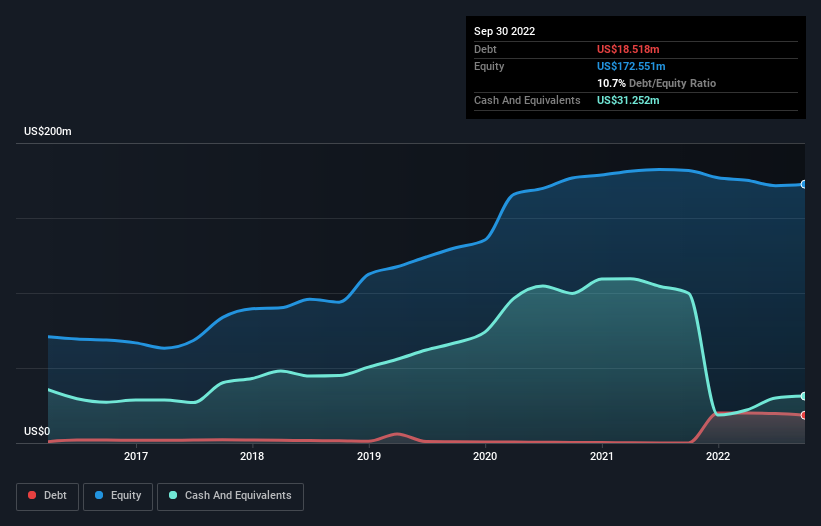
You can click the graphic below for the historical numbers, but it shows that as of September 2022 Kamada had US$18.5m of debt, an increase on US$52.0k, over one year. But it also has US$31.3m in cash to offset that, meaning it has US$12.7m net cash.
A Look At Kamada's Liabilities
We can see from the most recent balance sheet that Kamada had liabilities of US$69.2m falling due within a year, and liabilities of US$77.9m due beyond that. Offsetting these obligations, it had cash of US$31.3m as well as receivables valued at US$30.9m due within 12 months. So its liabilities total US$85.0m more than the combination of its cash and short-term receivables.
Kamada has a market capitalization of US$203.8m, so it could very likely raise cash to ameliorate its balance sheet, if the need arose. However, it is still worthwhile taking a close look at its ability to pay off debt. Despite its noteworthy liabilities, Kamada boasts net cash, so it's fair to say it does not have a heavy debt load! There's no doubt that we learn most about debt from the balance sheet. But it is future earnings, more than anything, that will determine Kamada's ability to maintain a healthy balance sheet going forward. So if you want to see what the professionals think, you might find this free report on analyst profit forecasts to be interesting.
Over 12 months, Kamada reported revenue of US$115m, which is a gain of 11%, although it did not report any earnings before interest and tax. We usually like to see faster growth from unprofitable companies, but each to their own.
So How Risky Is Kamada?
Although Kamada had an earnings before interest and tax (EBIT) loss over the last twelve months, it generated positive free cash flow of US$13m. So although it is loss-making, it doesn't seem to have too much near-term balance sheet risk, keeping in mind the net cash. Until we see some positive EBIT, we're a bit cautious of the stock, not least because of the rather modest revenue growth. When we look at a riskier company, we like to check how their profits (or losses) are trending over time. Today, we're providing readers this interactive graph showing how Kamada's profit, revenue, and operating cashflow have changed over the last few years.
If you're interested in investing in businesses that can grow profits without the burden of debt, then check out this free list of growing businesses that have net cash on the balance sheet.
Valuation is complex, but we're here to simplify it.
Discover if Kamada might be undervalued or overvalued with our detailed analysis, featuring fair value estimates, potential risks, dividends, insider trades, and its financial condition.
Access Free AnalysisHave feedback on this article? Concerned about the content? Get in touch with us directly. Alternatively, email editorial-team (at) simplywallst.com.
This article by Simply Wall St is general in nature. We provide commentary based on historical data and analyst forecasts only using an unbiased methodology and our articles are not intended to be financial advice. It does not constitute a recommendation to buy or sell any stock, and does not take account of your objectives, or your financial situation. We aim to bring you long-term focused analysis driven by fundamental data. Note that our analysis may not factor in the latest price-sensitive company announcements or qualitative material. Simply Wall St has no position in any stocks mentioned.
About TASE:KMDA
Flawless balance sheet with reasonable growth potential.
Similar Companies
Market Insights

Advertisement
Community Narratives
100% Patient Improvement in trial puts this $16M Biotech on the radar
Fair Value US$5.30|69.8% undervalued
JO
Community Contributor
Exxon Mobil's 17.5% Upside Promises Industry-Leading Returns in Energy Transition
Fair Value US$132.00|15.0% undervalued
HE
Community Contributor
NHC Analysis: Quality at a Good Price. A Golden Opportunity?
Fair Value US$179.80|36.1% undervalued
DA
Community Contributor
Product Refresh And Global Expansion Will Empower Future Market Leadership
Fair Value US$202.60|21.1% undervalued
AN
Based on Analyst Price Targets