
Advertisement
Is Polyram Plastic Industries LTD's (TLV:POLP) Stock's Recent Performance Being Led By Its Attractive Financial Prospects?

Most readers would already be aware that Polyram Plastic Industries' (TLV:POLP) stock increased significantly by 15% over the past three months. Given the company's impressive performance, we decided to study its financial indicators more closely as a company's financial health over the long-term usually dictates market outcomes. Specifically, we decided to study Polyram Plastic Industries' ROE in this article.
Return on Equity or ROE is a test of how effectively a company is growing its value and managing investors’ money. Put another way, it reveals the company's success at turning shareholder investments into profits.
How Do You Calculate Return On Equity?
Return on equity can be calculated by using the formula:
Return on Equity = Net Profit (from continuing operations) ÷ Shareholders' Equity
So, based on the above formula, the ROE for Polyram Plastic Industries is:
13% = ₪89m ÷ ₪665m (Based on the trailing twelve months to March 2025).
The 'return' is the income the business earned over the last year. Another way to think of that is that for every ₪1 worth of equity, the company was able to earn ₪0.13 in profit.
Check out our latest analysis for Polyram Plastic Industries
What Has ROE Got To Do With Earnings Growth?
We have already established that ROE serves as an efficient profit-generating gauge for a company's future earnings. Based on how much of its profits the company chooses to reinvest or "retain", we are then able to evaluate a company's future ability to generate profits. Generally speaking, other things being equal, firms with a high return on equity and profit retention, have a higher growth rate than firms that don’t share these attributes.
Polyram Plastic Industries' Earnings Growth And 13% ROE
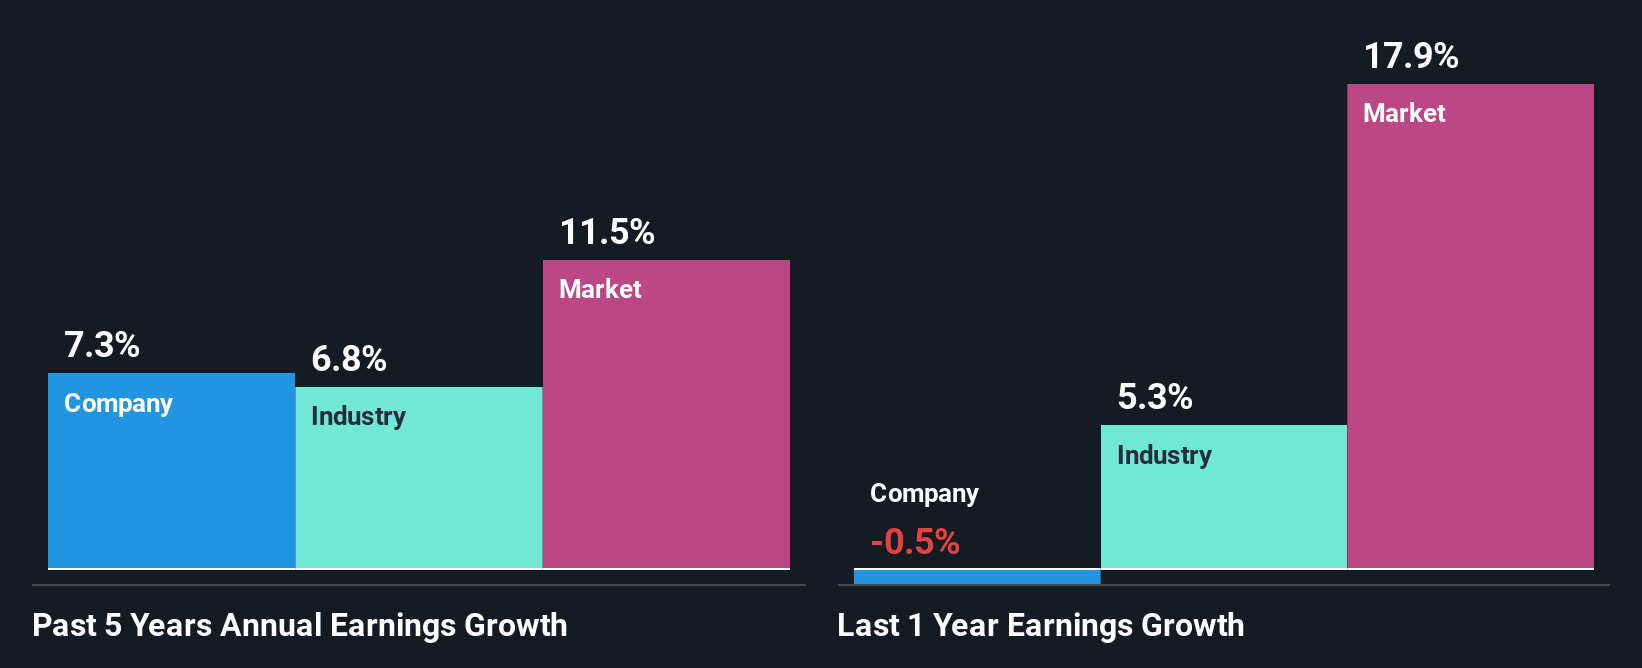
At first glance, Polyram Plastic Industries seems to have a decent ROE. Further, the company's ROE is similar to the industry average of 12%. This certainly adds some context to Polyram Plastic Industries' moderate 7.3% net income growth seen over the past five years.
We then performed a comparison between Polyram Plastic Industries' net income growth with the industry, which revealed that the company's growth is similar to the average industry growth of 6.8% in the same 5-year period.
The basis for attaching value to a company is, to a great extent, tied to its earnings growth. The investor should try to establish if the expected growth or decline in earnings, whichever the case may be, is priced in. By doing so, they will have an idea if the stock is headed into clear blue waters or if swampy waters await. If you're wondering about Polyram Plastic Industries''s valuation, check out this gauge of its price-to-earnings ratio, as compared to its industry.
Is Polyram Plastic Industries Using Its Retained Earnings Effectively?
While Polyram Plastic Industries has a three-year median payout ratio of 51% (which means it retains 49% of profits), the company has still seen a fair bit of earnings growth in the past, meaning that its high payout ratio hasn't hampered its ability to grow.
Additionally, Polyram Plastic Industries has paid dividends over a period of four years which means that the company is pretty serious about sharing its profits with shareholders.
Summary
Overall, we are quite pleased with Polyram Plastic Industries' performance. In particular, its high ROE is quite noteworthy and also the probable explanation behind its considerable earnings growth. Yet, the company is retaining a small portion of its profits. Which means that the company has been able to grow its earnings in spite of it, so that's not too bad. Until now, we have only just grazed the surface of the company's past performance by looking at the company's fundamentals. So it may be worth checking this free detailed graph of Polyram Plastic Industries' past earnings, as well as revenue and cash flows to get a deeper insight into the company's performance.
New: Manage All Your Stock Portfolios in One Place
We've created the ultimate portfolio companion for stock investors, and it's free.
• Connect an unlimited number of Portfolios and see your total in one currency
• Be alerted to new Warning Signs or Risks via email or mobile
• Track the Fair Value of your stocks
Have feedback on this article? Concerned about the content? Get in touch with us directly. Alternatively, email editorial-team (at) simplywallst.com.
This article by Simply Wall St is general in nature. We provide commentary based on historical data and analyst forecasts only using an unbiased methodology and our articles are not intended to be financial advice. It does not constitute a recommendation to buy or sell any stock, and does not take account of your objectives, or your financial situation. We aim to bring you long-term focused analysis driven by fundamental data. Note that our analysis may not factor in the latest price-sensitive company announcements or qualitative material. Simply Wall St has no position in any stocks mentioned.
About TASE:POLP
Polyram Plastic Industries
Manufactures and supplies thermoplastic compounds in Israel and internationally.
Adequate balance sheet with questionable track record.
Similar Companies
Market Insights


Advertisement
Community Narratives
For the Emperor: Why Games Workshop Could Be a Star Investment
Fair Value UK£160.00|0.4% overvalued
RO
Community Contributor
Securitas will boost margins with AI and tech-driven services
Fair Value SEK 260.91|44.5% undervalued
UN
Community Contributor
A Leader in EV Charging with Growth Potential
Fair Value €27.00|17.8% undervalued
TI
Community Contributor