- Israel
- /
- Healthcare Services
- /
- TASE:NVLG
Update: Novolog (Pharm-Up 1966) (TLV:NVLG) Stock Gained 88% In The Last Three Years


By buying an index fund, you can roughly match the market return with ease. But if you pick the right individual stocks, you could make more than that. For example, Novolog (Pharm-Up 1966) Ltd (TLV:NVLG) shareholders have seen the share price rise 88% over three years, well in excess of the market return (21%, not including dividends). However, more recent returns haven't been as impressive as that, with the stock returning just 42% in the last year , including dividends .
View our latest analysis for Novolog (Pharm-Up 1966)
To paraphrase Benjamin Graham: Over the short term the market is a voting machine, but over the long term it's a weighing machine. One way to examine how market sentiment has changed over time is to look at the interaction between a company's share price and its earnings per share (EPS).
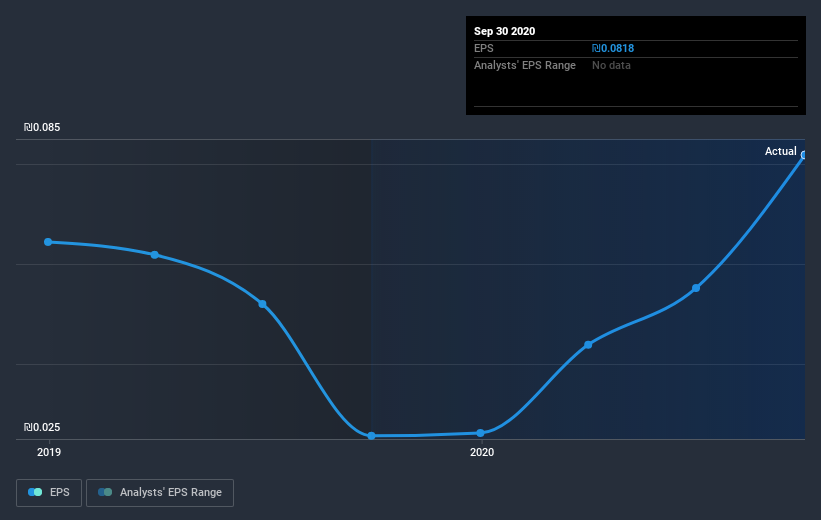
During three years of share price growth, Novolog (Pharm-Up 1966) achieved compound earnings per share growth of 8.3% per year. In comparison, the 23% per year gain in the share price outpaces the EPS growth. So it's fair to assume the market has a higher opinion of the business than it did three years ago. It's not unusual to see the market 're-rate' a stock, after a few years of growth.
You can see how EPS has changed over time in the image below (click on the chart to see the exact values).
Before buying or selling a stock, we always recommend a close examination of historic growth trends, available here.
What About Dividends?
As well as measuring the share price return, investors should also consider the total shareholder return (TSR). Whereas the share price return only reflects the change in the share price, the TSR includes the value of dividends (assuming they were reinvested) and the benefit of any discounted capital raising or spin-off. Arguably, the TSR gives a more comprehensive picture of the return generated by a stock. As it happens, Novolog (Pharm-Up 1966)'s TSR for the last 3 years was 99%, which exceeds the share price return mentioned earlier. The dividends paid by the company have thusly boosted the total shareholder return.
A Different Perspective
We're pleased to report that Novolog (Pharm-Up 1966) rewarded shareholders with a total shareholder return of 42% over the last year. That's including the dividend. So this year's TSR was actually better than the three-year TSR (annualized) of 26%. Given the track record of solid returns over varying time frames, it might be worth putting Novolog (Pharm-Up 1966) on your watchlist. It's always interesting to track share price performance over the longer term. But to understand Novolog (Pharm-Up 1966) better, we need to consider many other factors. Like risks, for instance. Every company has them, and we've spotted 2 warning signs for Novolog (Pharm-Up 1966) (of which 1 makes us a bit uncomfortable!) you should know about.
If you are like me, then you will not want to miss this free list of growing companies that insiders are buying.
Please note, the market returns quoted in this article reflect the market weighted average returns of stocks that currently trade on IL exchanges.
When trading Novolog (Pharm-Up 1966) or any other investment, use the platform considered by many to be the Professional's Gateway to the Worlds Market, Interactive Brokers. You get the lowest-cost* trading on stocks, options, futures, forex, bonds and funds worldwide from a single integrated account. Promoted
Valuation is complex, but we're here to simplify it.
Discover if Novolog (Pharm-Up 1966) might be undervalued or overvalued with our detailed analysis, featuring fair value estimates, potential risks, dividends, insider trades, and its financial condition.
Access Free AnalysisThis article by Simply Wall St is general in nature. It does not constitute a recommendation to buy or sell any stock, and does not take account of your objectives, or your financial situation. We aim to bring you long-term focused analysis driven by fundamental data. Note that our analysis may not factor in the latest price-sensitive company announcements or qualitative material. Simply Wall St has no position in any stocks mentioned.
*Interactive Brokers Rated Lowest Cost Broker by StockBrokers.com Annual Online Review 2020
Have feedback on this article? Concerned about the content? Get in touch with us directly. Alternatively, email editorial-team (at) simplywallst.com.
About TASE:NVLG
Excellent balance sheet and slightly overvalued.
Market Insights

Community Narratives


