- Israel
- /
- Healthcare Services
- /
- TASE:NVLG
Be Wary Of Novolog (Pharm-Up 1966) (TLV:NVLG) And Its Returns On Capital


What are the early trends we should look for to identify a stock that could multiply in value over the long term? Firstly, we'd want to identify a growing return on capital employed (ROCE) and then alongside that, an ever-increasing base of capital employed. Basically this means that a company has profitable initiatives that it can continue to reinvest in, which is a trait of a compounding machine. However, after briefly looking over the numbers, we don't think Novolog (Pharm-Up 1966) (TLV:NVLG) has the makings of a multi-bagger going forward, but let's have a look at why that may be.
Return On Capital Employed (ROCE): What Is It?
For those that aren't sure what ROCE is, it measures the amount of pre-tax profits a company can generate from the capital employed in its business. To calculate this metric for Novolog (Pharm-Up 1966), this is the formula:
Return on Capital Employed = Earnings Before Interest and Tax (EBIT) ÷ (Total Assets - Current Liabilities)
0.12 = ₪80m ÷ (₪2.5b - ₪1.9b) (Based on the trailing twelve months to March 2023).
Thus, Novolog (Pharm-Up 1966) has an ROCE of 12%. In absolute terms, that's a satisfactory return, but compared to the Healthcare industry average of 3.5% it's much better.
See our latest analysis for Novolog (Pharm-Up 1966)
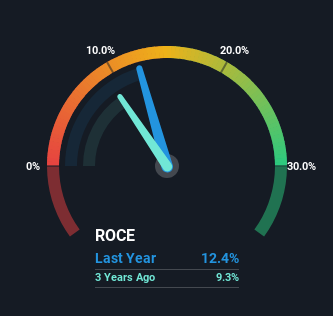
Historical performance is a great place to start when researching a stock so above you can see the gauge for Novolog (Pharm-Up 1966)'s ROCE against it's prior returns. If you're interested in investigating Novolog (Pharm-Up 1966)'s past further, check out this free graph of past earnings, revenue and cash flow.
So How Is Novolog (Pharm-Up 1966)'s ROCE Trending?
In terms of Novolog (Pharm-Up 1966)'s historical ROCE movements, the trend isn't fantastic. To be more specific, ROCE has fallen from 27% over the last five years. However, given capital employed and revenue have both increased it appears that the business is currently pursuing growth, at the consequence of short term returns. And if the increased capital generates additional returns, the business, and thus shareholders, will benefit in the long run.
On a side note, Novolog (Pharm-Up 1966) has done well to pay down its current liabilities to 75% of total assets. So we could link some of this to the decrease in ROCE. Effectively this means their suppliers or short-term creditors are funding less of the business, which reduces some elements of risk. Since the business is basically funding more of its operations with it's own money, you could argue this has made the business less efficient at generating ROCE. Keep in mind 75% is still pretty high, so those risks are still somewhat prevalent.
The Bottom Line On Novolog (Pharm-Up 1966)'s ROCE
In summary, despite lower returns in the short term, we're encouraged to see that Novolog (Pharm-Up 1966) is reinvesting for growth and has higher sales as a result. Furthermore the stock has climbed 68% over the last five years, it would appear that investors are upbeat about the future. So while the underlying trends could already be accounted for by investors, we still think this stock is worth looking into further.
On a final note, we've found 3 warning signs for Novolog (Pharm-Up 1966) that we think you should be aware of.
While Novolog (Pharm-Up 1966) isn't earning the highest return, check out this free list of companies that are earning high returns on equity with solid balance sheets.
Valuation is complex, but we're here to simplify it.
Discover if Novolog (Pharm-Up 1966) might be undervalued or overvalued with our detailed analysis, featuring fair value estimates, potential risks, dividends, insider trades, and its financial condition.
Access Free AnalysisHave feedback on this article? Concerned about the content? Get in touch with us directly. Alternatively, email editorial-team (at) simplywallst.com.
This article by Simply Wall St is general in nature. We provide commentary based on historical data and analyst forecasts only using an unbiased methodology and our articles are not intended to be financial advice. It does not constitute a recommendation to buy or sell any stock, and does not take account of your objectives, or your financial situation. We aim to bring you long-term focused analysis driven by fundamental data. Note that our analysis may not factor in the latest price-sensitive company announcements or qualitative material. Simply Wall St has no position in any stocks mentioned.
About TASE:NVLG
Excellent balance sheet and slightly overvalued.
Market Insights

Community Narratives


