
Advertisement
- Israel
- /
- Medical Equipment
- /
- TASE:ENDY
Endymed Ltd's (TLV:ENDY) 25% Dip In Price Shows Sentiment Is Matching Revenues

To the annoyance of some shareholders, Endymed Ltd (TLV:ENDY) shares are down a considerable 25% in the last month, which continues a horrid run for the company. Instead of being rewarded, shareholders who have already held through the last twelve months are now sitting on a 40% share price drop.
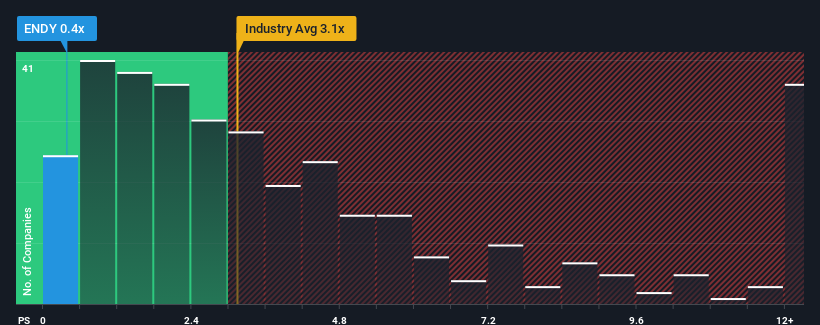
After such a large drop in price, Endymed may look like a strong buying opportunity at present with its price-to-sales (or "P/S") ratio of 0.4x, considering almost half of all companies in the Medical Equipment industry in Israel have P/S ratios greater than 2.7x and even P/S higher than 8x aren't out of the ordinary. Nonetheless, we'd need to dig a little deeper to determine if there is a rational basis for the highly reduced P/S.
See our latest analysis for Endymed
How Endymed Has Been Performing
For example, consider that Endymed's financial performance has been poor lately as its revenue has been in decline. One possibility is that the P/S is low because investors think the company won't do enough to avoid underperforming the broader industry in the near future. Those who are bullish on Endymed will be hoping that this isn't the case so that they can pick up the stock at a lower valuation.
We don't have analyst forecasts, but you can see how recent trends are setting up the company for the future by checking out our free report on Endymed's earnings, revenue and cash flow.What Are Revenue Growth Metrics Telling Us About The Low P/S?
Endymed's P/S ratio would be typical for a company that's expected to deliver very poor growth or even falling revenue, and importantly, perform much worse than the industry.
In reviewing the last year of financials, we were disheartened to see the company's revenues fell to the tune of 11%. At least revenue has managed not to go completely backwards from three years ago in aggregate, thanks to the earlier period of growth. Accordingly, shareholders probably wouldn't have been overly satisfied with the unstable medium-term growth rates.
Comparing that to the industry, which is predicted to deliver 19% growth in the next 12 months, the company's momentum is weaker, based on recent medium-term annualised revenue results.
In light of this, it's understandable that Endymed's P/S sits below the majority of other companies. It seems most investors are expecting to see the recent limited growth rates continue into the future and are only willing to pay a reduced amount for the stock.
The Bottom Line On Endymed's P/S
Having almost fallen off a cliff, Endymed's share price has pulled its P/S way down as well. Using the price-to-sales ratio alone to determine if you should sell your stock isn't sensible, however it can be a practical guide to the company's future prospects.
As we suspected, our examination of Endymed revealed its three-year revenue trends are contributing to its low P/S, given they look worse than current industry expectations. At this stage investors feel the potential for an improvement in revenue isn't great enough to justify a higher P/S ratio. Unless the recent medium-term conditions improve, they will continue to form a barrier for the share price around these levels.
It is also worth noting that we have found 3 warning signs for Endymed (2 can't be ignored!) that you need to take into consideration.
If these risks are making you reconsider your opinion on Endymed, explore our interactive list of high quality stocks to get an idea of what else is out there.
Valuation is complex, but we're here to simplify it.
Discover if Endymed might be undervalued or overvalued with our detailed analysis, featuring fair value estimates, potential risks, dividends, insider trades, and its financial condition.
Access Free AnalysisHave feedback on this article? Concerned about the content? Get in touch with us directly. Alternatively, email editorial-team (at) simplywallst.com.
This article by Simply Wall St is general in nature. We provide commentary based on historical data and analyst forecasts only using an unbiased methodology and our articles are not intended to be financial advice. It does not constitute a recommendation to buy or sell any stock, and does not take account of your objectives, or your financial situation. We aim to bring you long-term focused analysis driven by fundamental data. Note that our analysis may not factor in the latest price-sensitive company announcements or qualitative material. Simply Wall St has no position in any stocks mentioned.
About TASE:ENDY
Endymed
Provides energy based medical aesthetic treatment systems for the professional and consumer markets in North America, Europe, the Middle East, Africa, Asia, Oceania, Latin America, and internationally.
Flawless balance sheet and slightly overvalued.
Market Insights

Advertisement
Community Narratives
WhiteCap Is Positioned To Profit Regardless Of Trump's Policy 
Fair Value CA$22.60|61.6% undervalued
ST
Equity Analyst and Writer
Microsoft's Evolution Will Drive Revenue to New Heights Fueled by AI
Fair Value US$360.00|28.3% overvalued
BR
Community Contributor
A CASE FOR USD$2.50 (CAD$3.44) BY 2028 (A 5-10 BAGGER)
Fair Value CA$3.44|87.8% undervalued
AG
Community Contributor