Do Its Financials Have Any Role To Play In Driving Strauss Group Ltd.'s (TLV:STRS) Stock Up Recently?


Strauss Group (TLV:STRS) has had a great run on the share market with its stock up by a significant 8.7% over the last month. As most would know, fundamentals are what usually guide market price movements over the long-term, so we decided to look at the company's key financial indicators today to determine if they have any role to play in the recent price movement. In this article, we decided to focus on Strauss Group's ROE.
Return on Equity or ROE is a test of how effectively a company is growing its value and managing investors’ money. In other words, it is a profitability ratio which measures the rate of return on the capital provided by the company's shareholders.
View our latest analysis for Strauss Group
How Is ROE Calculated?
Return on equity can be calculated by using the formula:
Return on Equity = Net Profit (from continuing operations) ÷ Shareholders' Equity
So, based on the above formula, the ROE for Strauss Group is:
12% = ₪394m ÷ ₪3.2b (Based on the trailing twelve months to June 2024).
The 'return' refers to a company's earnings over the last year. Another way to think of that is that for every ₪1 worth of equity, the company was able to earn ₪0.12 in profit.
Why Is ROE Important For Earnings Growth?
Thus far, we have learned that ROE measures how efficiently a company is generating its profits. Depending on how much of these profits the company reinvests or "retains", and how effectively it does so, we are then able to assess a company’s earnings growth potential. Generally speaking, other things being equal, firms with a high return on equity and profit retention, have a higher growth rate than firms that don’t share these attributes.
Strauss Group's Earnings Growth And 12% ROE
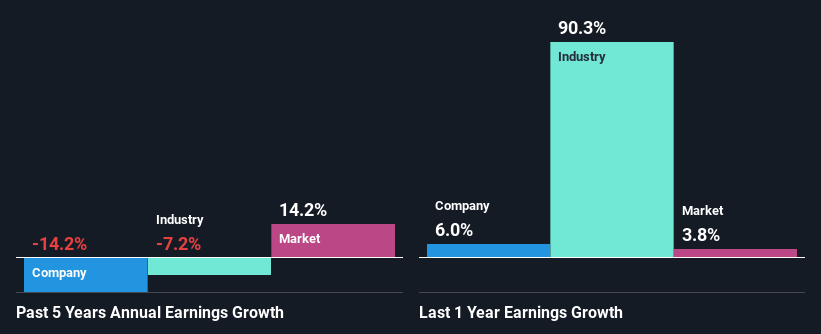
To start with, Strauss Group's ROE looks acceptable. And on comparing with the industry, we found that the the average industry ROE is similar at 13%. As you might expect, the 14% net income decline reported by Strauss Group is a bit of a surprise. We reckon that there could be some other factors at play here that are preventing the company's growth. For example, it could be that the company has a high payout ratio or the business has allocated capital poorly, for instance.
As a next step, we compared Strauss Group's performance with the industry and found thatStrauss Group's performance is depressing even when compared with the industry, which has shrunk its earnings at a rate of 7.2% in the same period, which is a slower than the company.
The basis for attaching value to a company is, to a great extent, tied to its earnings growth. What investors need to determine next is if the expected earnings growth, or the lack of it, is already built into the share price. Doing so will help them establish if the stock's future looks promising or ominous. Is Strauss Group fairly valued compared to other companies? These 3 valuation measures might help you decide.
Is Strauss Group Making Efficient Use Of Its Profits?
Strauss Group's declining earnings is not surprising given how the company is spending most of its profits in paying dividends, judging by its three-year median payout ratio of 69% (or a retention ratio of 31%). With only a little being reinvested into the business, earnings growth would obviously be low or non-existent. To know the 4 risks we have identified for Strauss Group visit our risks dashboard for free.
Moreover, Strauss Group has been paying dividends for at least ten years or more suggesting that management must have perceived that the shareholders prefer dividends over earnings growth.
Summary
On the whole, we do feel that Strauss Group has some positive attributes. However, while the company does have a high ROE, its earnings growth number is quite disappointing. This can be blamed on the fact that it reinvests only a small portion of its profits and pays out the rest as dividends. Until now, we have only just grazed the surface of the company's past performance by looking at the company's fundamentals. To gain further insights into Strauss Group's past profit growth, check out this visualization of past earnings, revenue and cash flows.
New: Manage All Your Stock Portfolios in One Place
We've created the ultimate portfolio companion for stock investors, and it's free.
• Connect an unlimited number of Portfolios and see your total in one currency
• Be alerted to new Warning Signs or Risks via email or mobile
• Track the Fair Value of your stocks
Have feedback on this article? Concerned about the content? Get in touch with us directly. Alternatively, email editorial-team (at) simplywallst.com.
This article by Simply Wall St is general in nature. We provide commentary based on historical data and analyst forecasts only using an unbiased methodology and our articles are not intended to be financial advice. It does not constitute a recommendation to buy or sell any stock, and does not take account of your objectives, or your financial situation. We aim to bring you long-term focused analysis driven by fundamental data. Note that our analysis may not factor in the latest price-sensitive company announcements or qualitative material. Simply Wall St has no position in any stocks mentioned.
About TASE:STRS
Strauss Group
Develops, manufactures, markets, sells, and distributes various food and beverage products in Israel, North America, Brazil, Europe, and internationally.
Mediocre balance sheet second-rate dividend payer.

