

David Iben put it well when he said, 'Volatility is not a risk we care about. What we care about is avoiding the permanent loss of capital.' It's only natural to consider a company's balance sheet when you examine how risky it is, since debt is often involved when a business collapses. We note that Tomer Energy Royalties (2012) Ltd (TLV:TOEN) does have debt on its balance sheet. But the real question is whether this debt is making the company risky.
What Risk Does Debt Bring?
Debt is a tool to help businesses grow, but if a business is incapable of paying off its lenders, then it exists at their mercy. Ultimately, if the company can't fulfill its legal obligations to repay debt, shareholders could walk away with nothing. However, a more common (but still painful) scenario is that it has to raise new equity capital at a low price, thus permanently diluting shareholders. By replacing dilution, though, debt can be an extremely good tool for businesses that need capital to invest in growth at high rates of return. The first step when considering a company's debt levels is to consider its cash and debt together.
View our latest analysis for Tomer Energy Royalties (2012)
How Much Debt Does Tomer Energy Royalties (2012) Carry?
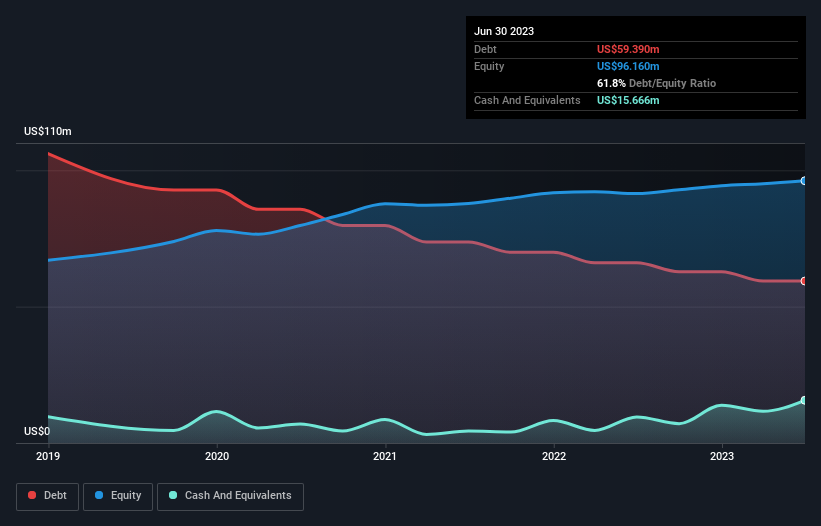
As you can see below, Tomer Energy Royalties (2012) had US$59.4m of debt at June 2023, down from US$66.1m a year prior. On the flip side, it has US$15.7m in cash leading to net debt of about US$43.7m.
A Look At Tomer Energy Royalties (2012)'s Liabilities
According to the last reported balance sheet, Tomer Energy Royalties (2012) had liabilities of US$10.5m due within 12 months, and liabilities of US$56.3m due beyond 12 months. On the other hand, it had cash of US$15.7m and US$3.17m worth of receivables due within a year. So its liabilities total US$47.9m more than the combination of its cash and short-term receivables.
This is a mountain of leverage relative to its market capitalization of US$64.3m. This suggests shareholders would be heavily diluted if the company needed to shore up its balance sheet in a hurry.
We use two main ratios to inform us about debt levels relative to earnings. The first is net debt divided by earnings before interest, tax, depreciation, and amortization (EBITDA), while the second is how many times its earnings before interest and tax (EBIT) covers its interest expense (or its interest cover, for short). The advantage of this approach is that we take into account both the absolute quantum of debt (with net debt to EBITDA) and the actual interest expenses associated with that debt (with its interest cover ratio).
Tomer Energy Royalties (2012)'s debt is 2.8 times its EBITDA, and its EBIT cover its interest expense 3.7 times over. Taken together this implies that, while we wouldn't want to see debt levels rise, we think it can handle its current leverage. Even more troubling is the fact that Tomer Energy Royalties (2012) actually let its EBIT decrease by 3.0% over the last year. If that earnings trend continues the company will face an uphill battle to pay off its debt. The balance sheet is clearly the area to focus on when you are analysing debt. But it is Tomer Energy Royalties (2012)'s earnings that will influence how the balance sheet holds up in the future. So when considering debt, it's definitely worth looking at the earnings trend. Click here for an interactive snapshot.
Finally, a business needs free cash flow to pay off debt; accounting profits just don't cut it. So it's worth checking how much of that EBIT is backed by free cash flow. Happily for any shareholders, Tomer Energy Royalties (2012) actually produced more free cash flow than EBIT over the last three years. That sort of strong cash conversion gets us as excited as the crowd when the beat drops at a Daft Punk concert.
Our View
Tomer Energy Royalties (2012)'s interest cover and level of total liabilities definitely weigh on it, in our esteem. But its conversion of EBIT to free cash flow tells a very different story, and suggests some resilience. Looking at all the angles mentioned above, it does seem to us that Tomer Energy Royalties (2012) is a somewhat risky investment as a result of its debt. That's not necessarily a bad thing, since leverage can boost returns on equity, but it is something to be aware of. There's no doubt that we learn most about debt from the balance sheet. But ultimately, every company can contain risks that exist outside of the balance sheet. Case in point: We've spotted 3 warning signs for Tomer Energy Royalties (2012) you should be aware of, and 1 of them is a bit unpleasant.
Of course, if you're the type of investor who prefers buying stocks without the burden of debt, then don't hesitate to discover our exclusive list of net cash growth stocks, today.
If you're looking to trade Tomer Energy Royalties (2012), open an account with the lowest-cost platform trusted by professionals, Interactive Brokers.
With clients in over 200 countries and territories, and access to 160 markets, IBKR lets you trade stocks, options, futures, forex, bonds and funds from a single integrated account.
Enjoy no hidden fees, no account minimums, and FX conversion rates as low as 0.03%, far better than what most brokers offer.
Sponsored ContentValuation is complex, but we're here to simplify it.
Discover if Tomer Energy Royalties (2012) might be undervalued or overvalued with our detailed analysis, featuring fair value estimates, potential risks, dividends, insider trades, and its financial condition.
Access Free AnalysisHave feedback on this article? Concerned about the content? Get in touch with us directly. Alternatively, email editorial-team (at) simplywallst.com.
This article by Simply Wall St is general in nature. We provide commentary based on historical data and analyst forecasts only using an unbiased methodology and our articles are not intended to be financial advice. It does not constitute a recommendation to buy or sell any stock, and does not take account of your objectives, or your financial situation. We aim to bring you long-term focused analysis driven by fundamental data. Note that our analysis may not factor in the latest price-sensitive company announcements or qualitative material. Simply Wall St has no position in any stocks mentioned.
About TASE:TOEN
Tomer Energy Royalties (2012)
A special-purpose yield company, holds the right to receive overriding royalties in respect of oil and/or gas, and/or other valuable materials derived from the shares of various oil and gas companies and entities in Israel.
Moderate with imperfect balance sheet.
Market Insights

Community Narratives

