
Advertisement
- Israel
- /
- Oil and Gas
- /
- TASE:RATI
These 4 Measures Indicate That Ratio Oil Exploration (1992) Limited Partnership (TLV:RATI.L) Is Using Debt In A Risky Way
The external fund manager backed by Berkshire Hathaway's Charlie Munger, Li Lu, makes no bones about it when he says 'The biggest investment risk is not the volatility of prices, but whether you will suffer a permanent loss of capital.' It's only natural to consider a company's balance sheet when you examine how risky it is, since debt is often involved when a business collapses. We note that Ratio Oil Exploration (1992) Limited Partnership (TLV:RATI.L) does have debt on its balance sheet. But is this debt a concern to shareholders?
When Is Debt A Problem?
Debt and other liabilities become risky for a business when it cannot easily fulfill those obligations, either with free cash flow or by raising capital at an attractive price. In the worst case scenario, a company can go bankrupt if it cannot pay its creditors. However, a more usual (but still expensive) situation is where a company must dilute shareholders at a cheap share price simply to get debt under control. Having said that, the most common situation is where a company manages its debt reasonably well - and to its own advantage. When we think about a company's use of debt, we first look at cash and debt together.
View our latest analysis for Ratio Oil Exploration (1992) Limited Partnership
How Much Debt Does Ratio Oil Exploration (1992) Limited Partnership Carry?
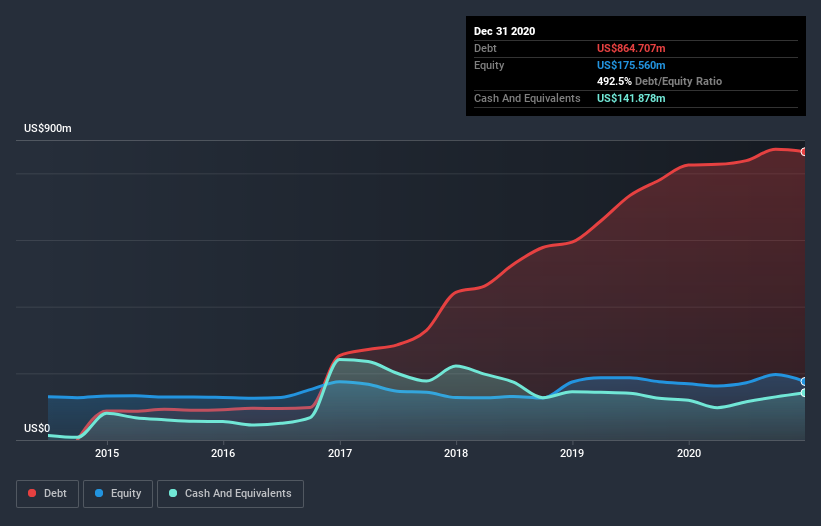
The image below, which you can click on for greater detail, shows that at December 2020 Ratio Oil Exploration (1992) Limited Partnership had debt of US$864.7m, up from US$825.1m in one year. However, it does have US$141.9m in cash offsetting this, leading to net debt of about US$722.8m.
How Strong Is Ratio Oil Exploration (1992) Limited Partnership's Balance Sheet?
Zooming in on the latest balance sheet data, we can see that Ratio Oil Exploration (1992) Limited Partnership had liabilities of US$165.1m due within 12 months and liabilities of US$754.9m due beyond that. Offsetting this, it had US$141.9m in cash and US$50.1m in receivables that were due within 12 months. So its liabilities outweigh the sum of its cash and (near-term) receivables by US$728.0m.
The deficiency here weighs heavily on the US$452.2m company itself, as if a child were struggling under the weight of an enormous back-pack full of books, his sports gear, and a trumpet. So we'd watch its balance sheet closely, without a doubt. At the end of the day, Ratio Oil Exploration (1992) Limited Partnership would probably need a major re-capitalization if its creditors were to demand repayment.
In order to size up a company's debt relative to its earnings, we calculate its net debt divided by its earnings before interest, tax, depreciation, and amortization (EBITDA) and its earnings before interest and tax (EBIT) divided by its interest expense (its interest cover). The advantage of this approach is that we take into account both the absolute quantum of debt (with net debt to EBITDA) and the actual interest expenses associated with that debt (with its interest cover ratio).
Ratio Oil Exploration (1992) Limited Partnership shareholders face the double whammy of a high net debt to EBITDA ratio (5.5), and fairly weak interest coverage, since EBIT is just 1.8 times the interest expense. The debt burden here is substantial. One redeeming factor for Ratio Oil Exploration (1992) Limited Partnership is that it turned last year's EBIT loss into a gain of US$107m, over the last twelve months. There's no doubt that we learn most about debt from the balance sheet. But it is Ratio Oil Exploration (1992) Limited Partnership's earnings that will influence how the balance sheet holds up in the future. So when considering debt, it's definitely worth looking at the earnings trend. Click here for an interactive snapshot.
Finally, a business needs free cash flow to pay off debt; accounting profits just don't cut it. So it is important to check how much of its earnings before interest and tax (EBIT) converts to actual free cash flow. Considering the last year, Ratio Oil Exploration (1992) Limited Partnership actually recorded a cash outflow, overall. Debt is usually more expensive, and almost always more risky in the hands of a company with negative free cash flow. Shareholders ought to hope for an improvement.
Our View
To be frank both Ratio Oil Exploration (1992) Limited Partnership's conversion of EBIT to free cash flow and its track record of staying on top of its total liabilities make us rather uncomfortable with its debt levels. Having said that, its ability to grow its EBIT isn't such a worry. After considering the datapoints discussed, we think Ratio Oil Exploration (1992) Limited Partnership has too much debt. While some investors love that sort of risky play, it's certainly not our cup of tea. When analysing debt levels, the balance sheet is the obvious place to start. However, not all investment risk resides within the balance sheet - far from it. For example Ratio Oil Exploration (1992) Limited Partnership has 2 warning signs (and 1 which shouldn't be ignored) we think you should know about.
Of course, if you're the type of investor who prefers buying stocks without the burden of debt, then don't hesitate to discover our exclusive list of net cash growth stocks, today.
If you decide to trade Ratio Oil Exploration (1992) Limited Partnership, use the lowest-cost* platform that is rated #1 Overall by Barron’s, Interactive Brokers. Trade stocks, options, futures, forex, bonds and funds on 135 markets, all from a single integrated account. Promoted
New: AI Stock Screener & Alerts
Our new AI Stock Screener scans the market every day to uncover opportunities.
• Dividend Powerhouses (3%+ Yield)
• Undervalued Small Caps with Insider Buying
• High growth Tech and AI Companies
Or build your own from over 50 metrics.
This article by Simply Wall St is general in nature. It does not constitute a recommendation to buy or sell any stock, and does not take account of your objectives, or your financial situation. We aim to bring you long-term focused analysis driven by fundamental data. Note that our analysis may not factor in the latest price-sensitive company announcements or qualitative material. Simply Wall St has no position in any stocks mentioned.
*Interactive Brokers Rated Lowest Cost Broker by StockBrokers.com Annual Online Review 2020
Have feedback on this article? Concerned about the content? Get in touch with us directly. Alternatively, email editorial-team (at) simplywallst.com.
About TASE:RATI
Ratio Energies - Limited Partnership
Explores, develops, and produces oil and natural gas in Israel and internationally.
Good value with proven track record.
Market Insights


Advertisement
Community Narratives
The Next Phase of Energy Storage: How NeoVolta Is Tackling America’s Power Crunch
Fair Value US$7.50|40.5% undervalued
MA
Community Contributor
Why EnSilica is Worth Possibly 13x its Current Price
Fair Value UK£5.00|91.8% undervalued
DO
Community Contributor
M&A Activity, Industry Diversification & A Defense Contract Monopoly Will Push BWXT For Healthy Long-Term Growth
Fair Value US$220.00|16.2% undervalued
CL
Community Contributor
A case for Cassiar Gold Corp (TSXV: GLDC) to reach CAD$8-10 before 2030 (X30-37)
Fair Value CA$10.00|97.5% undervalued
AG
Community Contributor