- Israel
- /
- Capital Markets
- /
- TASE:GUID
Trendline Information and Communication Services Ltd.'s (TLV:TREN) Price Is Right But Growth Is Lacking

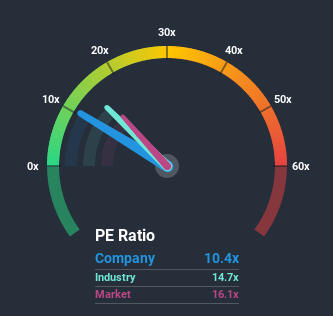
Trendline Information and Communication Services Ltd.'s (TLV:TREN) price-to-earnings (or "P/E") ratio of 10.4x might make it look like a buy right now compared to the market in Israel, where around half of the companies have P/E ratios above 17x and even P/E's above 26x are quite common. Although, it's not wise to just take the P/E at face value as there may be an explanation why it's limited.
We'd have to say that with no tangible growth over the last year, Trendline Information and Communication Services' earnings have been unimpressive. One possibility is that the P/E is low because investors think this benign earnings growth rate will likely underperform the broader market in the near future. If not, then existing shareholders may be feeling optimistic about the future direction of the share price.
Check out our latest analysis for Trendline Information and Communication Services

How Is Trendline Information and Communication Services' Growth Trending?
In order to justify its P/E ratio, Trendline Information and Communication Services would need to produce sluggish growth that's trailing the market.
Retrospectively, the last year delivered virtually the same number to the company's bottom line as the year before. Fortunately, a few good years before that means that it was still able to grow EPS by 15% in total over the last three years. Accordingly, shareholders probably wouldn't have been overly satisfied with the unstable medium-term growth rates.
This is in contrast to the rest of the market, which is expected to grow by 63% over the next year, materially higher than the company's recent medium-term annualised growth rates.
With this information, we can see why Trendline Information and Communication Services is trading at a P/E lower than the market. It seems most investors are expecting to see the recent limited growth rates continue into the future and are only willing to pay a reduced amount for the stock.
What We Can Learn From Trendline Information and Communication Services' P/E?
Using the price-to-earnings ratio alone to determine if you should sell your stock isn't sensible, however it can be a practical guide to the company's future prospects.
As we suspected, our examination of Trendline Information and Communication Services revealed its three-year earnings trends are contributing to its low P/E, given they look worse than current market expectations. At this stage investors feel the potential for an improvement in earnings isn't great enough to justify a higher P/E ratio. Unless the recent medium-term conditions improve, they will continue to form a barrier for the share price around these levels.
And what about other risks? Every company has them, and we've spotted 2 warning signs for Trendline Information and Communication Services (of which 1 can't be ignored!) you should know about.
It's important to make sure you look for a great company, not just the first idea you come across. So take a peek at this free list of interesting companies with strong recent earnings growth (and a P/E ratio below 20x).
When trading Trendline Information and Communication Services or any other investment, use the platform considered by many to be the Professional's Gateway to the Worlds Market, Interactive Brokers. You get the lowest-cost* trading on stocks, options, futures, forex, bonds and funds worldwide from a single integrated account. Promoted
New: Manage All Your Stock Portfolios in One Place
We've created the ultimate portfolio companion for stock investors, and it's free.
• Connect an unlimited number of Portfolios and see your total in one currency
• Be alerted to new Warning Signs or Risks via email or mobile
• Track the Fair Value of your stocks
This article by Simply Wall St is general in nature. It does not constitute a recommendation to buy or sell any stock, and does not take account of your objectives, or your financial situation. We aim to bring you long-term focused analysis driven by fundamental data. Note that our analysis may not factor in the latest price-sensitive company announcements or qualitative material. Simply Wall St has no position in any stocks mentioned.
*Interactive Brokers Rated Lowest Cost Broker by StockBrokers.com Annual Online Review 2020
Have feedback on this article? Concerned about the content? Get in touch with us directly. Alternatively, email editorial-team (at) simplywallst.com.
About TASE:GUID
Guideline Group Information Technologies
Provides information services and professional tools for business users in Israel.
Mediocre balance sheet low.
Market Insights
Community Narratives


