Advertisement
- Israel
- /
- Hospitality
- /
- TASE:TRA
Middle Eastern Penny Stocks With Market Caps Over US$50M

Simply Wall St
Reviewed by Simply Wall St
As Middle Eastern markets show varied performances with Gulf indices generally gaining and Saudi Arabia's bourse experiencing a slight dip, investors remain focused on earnings reports. In this context, penny stocks—often representing smaller or newer companies—continue to capture attention for their potential to offer unexpected opportunities. Despite being an older term, penny stocks can still hold significant value when supported by robust financials, and we will explore three such stocks that stand out for their promising balance sheets and growth potential.
Top 10 Penny Stocks In The Middle East
| Name | Share Price | Market Cap | Rewards & Risks |
| Thob Al Aseel (SASE:4012) | SAR3.60 | SAR1.44B | ✅ 2 ⚠️ 1 View Analysis > |
| Alarum Technologies (TASE:ALAR) | ₪4.83 | ₪344.93M | ✅ 3 ⚠️ 1 View Analysis > |
| E7 Group PJSC (ADX:E7) | AED1.06 | AED2.12B | ✅ 5 ⚠️ 3 View Analysis > |
| Sharjah Insurance Company P.S.C (ADX:SICO) | AED1.49 | AED225M | ✅ 2 ⚠️ 3 View Analysis > |
| Al Wathba National Insurance Company PJSC (ADX:AWNIC) | AED3.40 | AED703.8M | ✅ 2 ⚠️ 3 View Analysis > |
| Dubai National Insurance & Reinsurance (P.S.C.) (DFM:DNIR) | AED3.20 | AED369.6M | ✅ 2 ⚠️ 4 View Analysis > |
| Dubai Investments PJSC (DFM:DIC) | AED3.25 | AED13.95B | ✅ 2 ⚠️ 3 View Analysis > |
| Union Properties (DFM:UPP) | AED0.81 | AED3.52B | ✅ 3 ⚠️ 2 View Analysis > |
| Sharjah Cement and Industrial Development (PJSC) (ADX:SCIDC) | AED0.823 | AED500.59M | ✅ 2 ⚠️ 2 View Analysis > |
| Tgi Infrastructures (TASE:TGI) | ₪2.792 | ₪222.31M | ✅ 2 ⚠️ 2 View Analysis > |
Click here to see the full list of 79 stocks from our Middle Eastern Penny Stocks screener.
Let's explore several standout options from the results in the screener.
Arsan Tekstil Ticaret ve Sanayi Anonim Sirketi (IBSE:ARSAN)
Simply Wall St Financial Health Rating: ★★★★★☆
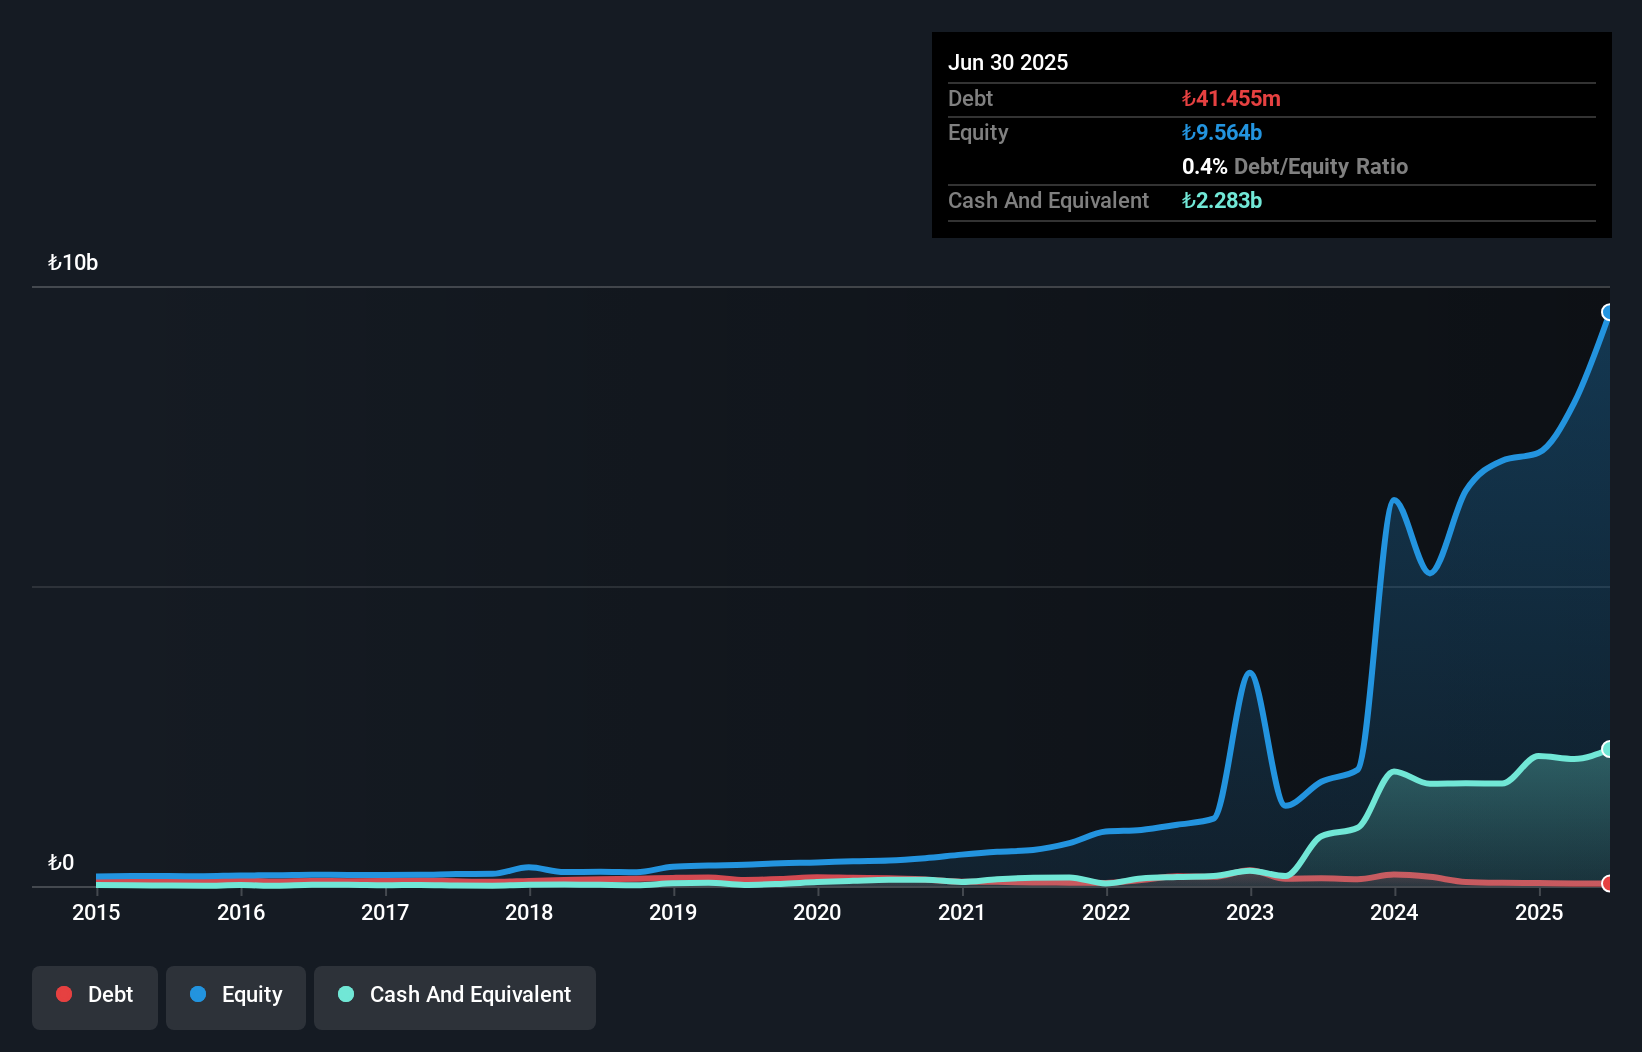
Overview: Arsan Tekstil Ticaret ve Sanayi Anonim Sirketi, along with its subsidiaries, is involved in the production and sale of cotton and synthetic yarn both in Turkey and internationally, with a market cap of TRY4.93 billion.
Operations: The company generates its revenue from two primary segments: Textile, contributing TRY48.12 million, and Tourism, accounting for TRY60.49 million.
Market Cap: TRY4.93B
Arsan Tekstil Ticaret ve Sanayi Anonim Sirketi, with a market cap of TRY4.93 billion, is currently unprofitable but has reduced its losses over the past five years by 37.2% annually. The company holds more cash than its total debt and has significantly reduced its debt-to-equity ratio from 30.9% to 0.4% over five years, indicating improved financial health despite not having meaningful revenue (TRY108M). Recent earnings showed a net loss of TRY66.91 million for Q2 2025, contrasting sharply with a net income of TRY914.64 million in the same period last year, highlighting volatility in performance.
- Dive into the specifics of Arsan Tekstil Ticaret ve Sanayi Anonim Sirketi here with our thorough balance sheet health report.
- Evaluate Arsan Tekstil Ticaret ve Sanayi Anonim Sirketi's historical performance by accessing our past performance report.
Hun Yenilenebilir Enerji Üretim (IBSE:HUNER)
Simply Wall St Financial Health Rating: ★★★★☆☆
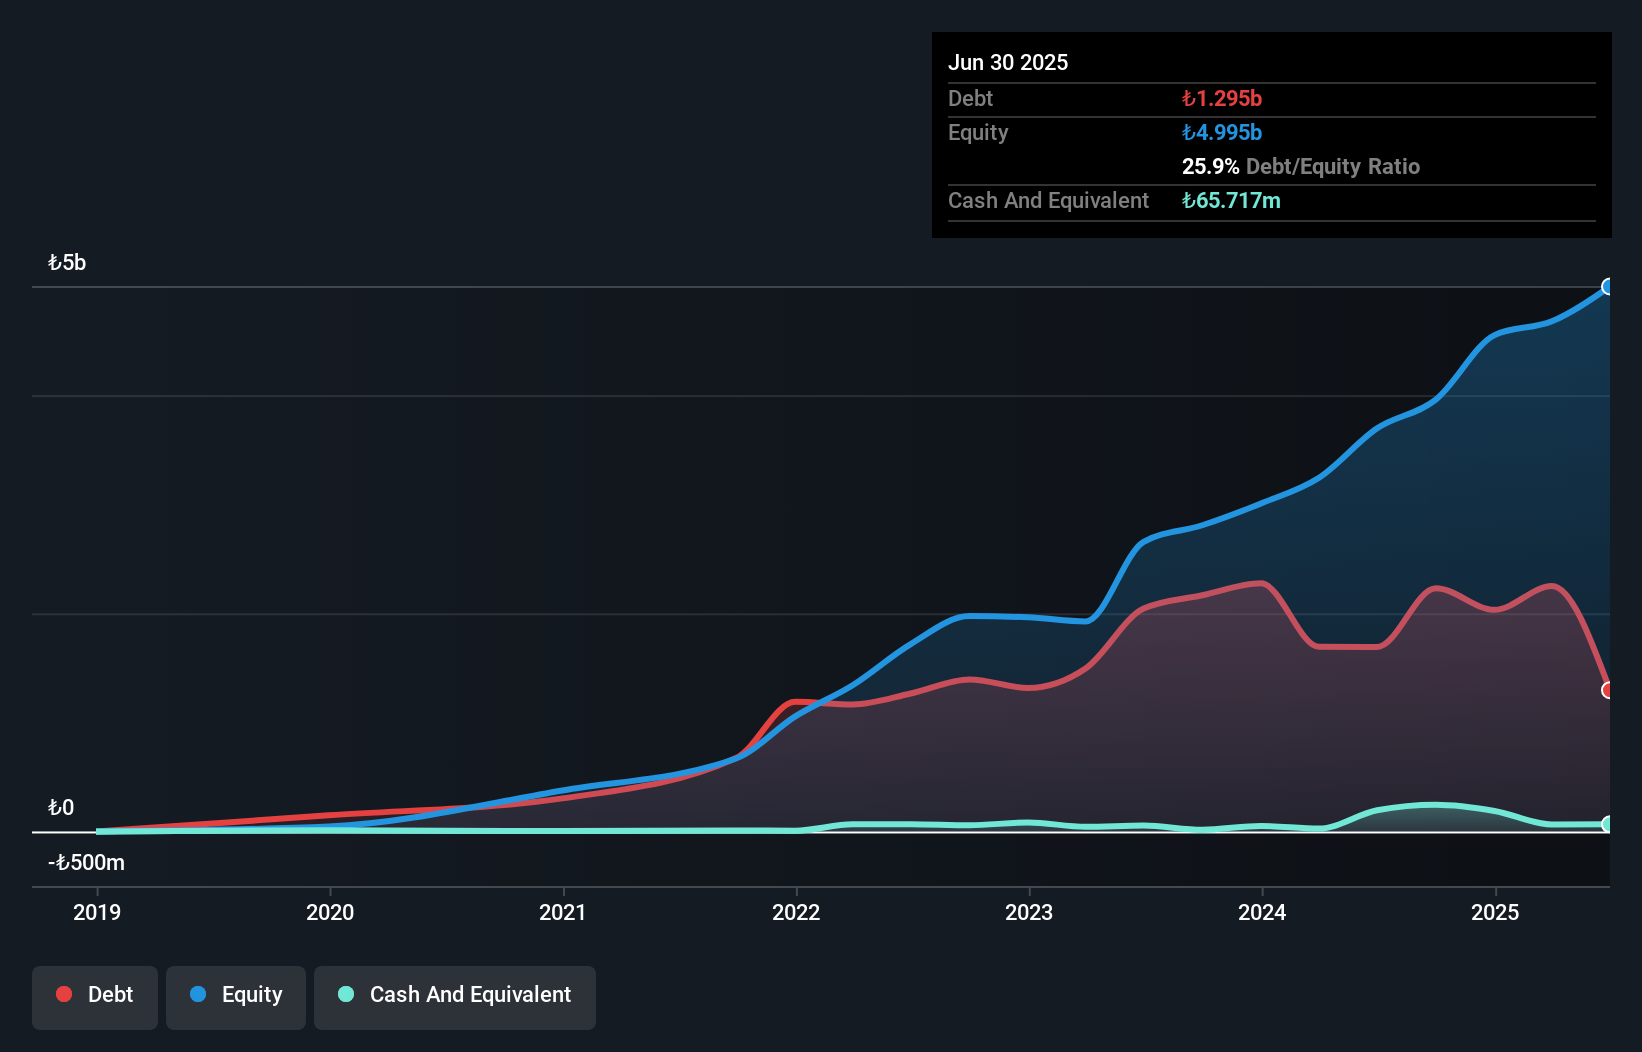
Overview: Hun Yenilenebilir Enerji Üretim A.S. operates in the renewable energy sector by establishing, constructing, commissioning, renting, generating, and selling electrical energy and capacity to transmission and distribution companies both in Turkey and internationally, with a market cap of TRY3.57 billion.
Operations: The company generates revenue primarily through its production and sales segment, amounting to TRY946.13 million.
Market Cap: TRY3.57B
Hun Yenilenebilir Enerji Üretim A.S., with a market cap of TRY3.57 billion, has demonstrated financial resilience by becoming profitable in the past year, reporting a net income of TRY50.17 million for the first half of 2025. Despite having short-term assets (TRY428.5M) that do not cover its short-term liabilities (TRY1.1B), the company's debt is well-managed with a net debt to equity ratio at 39.3% and operating cash flow covering 44.8% of its debt. The price-to-earnings ratio stands attractively low at 5.8x compared to the Turkish market average, indicating potential value for investors interested in penny stocks within renewable energy sectors in emerging markets like Turkey's.
- Click to explore a detailed breakdown of our findings in Hun Yenilenebilir Enerji Üretim's financial health report.
- Gain insights into Hun Yenilenebilir Enerji Üretim's past trends and performance with our report on the company's historical track record.
Tarya Israel (TASE:TRA)
Simply Wall St Financial Health Rating: ★★★★★☆
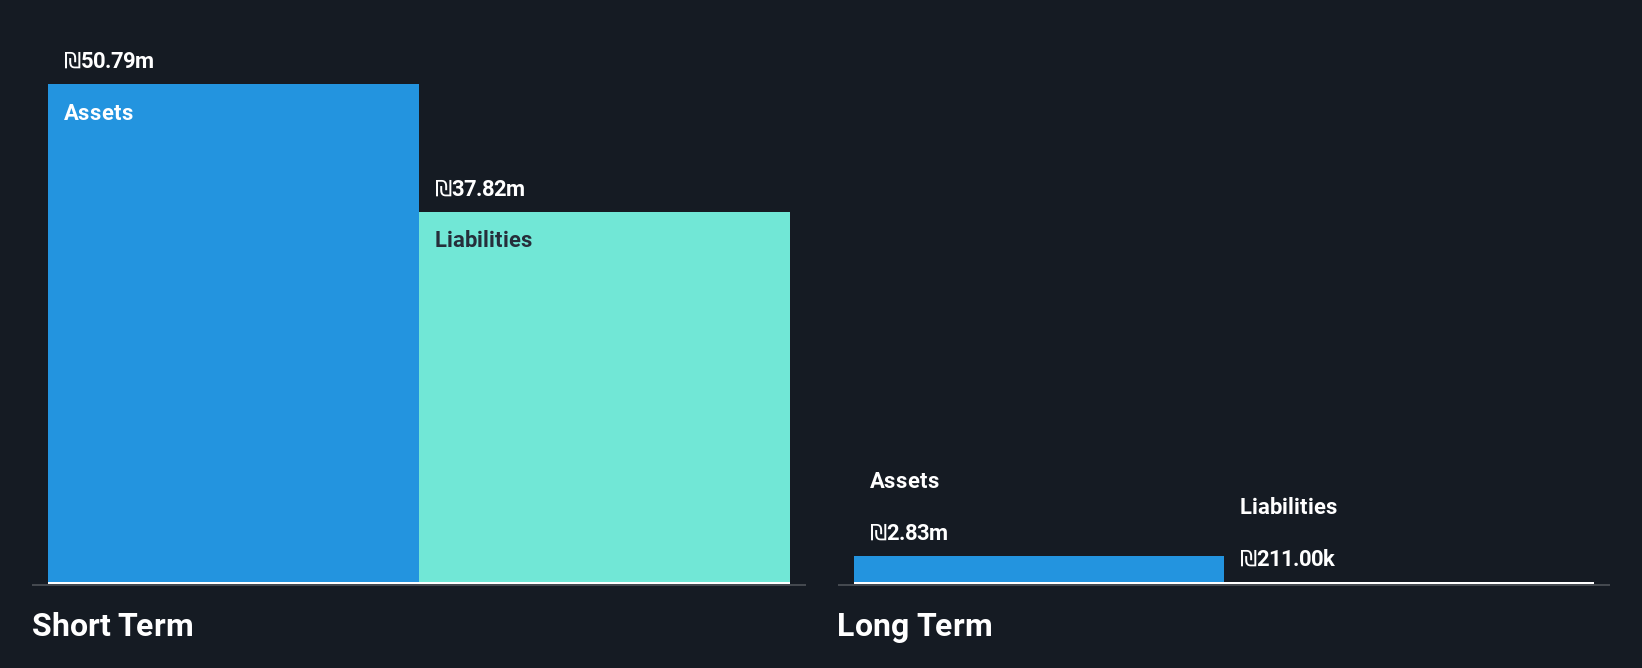
Overview: Tarya Israel Ltd, along with its subsidiaries, operates an internet platform in Israel and has a market cap of ₪169.21 million.
Operations: The company's revenue is derived from two main segments: Credit Brokerage, contributing ₪41.13 million, and Credit Provision, adding ₪0.30 million.
Market Cap: ₪169.21M
Tarya Israel Ltd, with a market cap of ₪169.21 million, operates in the financial sector with revenue streams primarily from Credit Brokerage and Credit Provision. Despite its unprofitability, Tarya maintains a stable cash runway exceeding three years and has more cash than debt, indicating financial resilience. The company's short-term assets comfortably cover both short-term and long-term liabilities. However, recent earnings reports show declining sales and net income compared to the previous year, reflecting challenges in revenue generation. The board's average tenure suggests experienced oversight amidst high share price volatility typical for penny stocks in emerging markets like Israel's.
- Navigate through the intricacies of Tarya Israel with our comprehensive balance sheet health report here.
- Understand Tarya Israel's track record by examining our performance history report.
Make It Happen
- Investigate our full lineup of 79 Middle Eastern Penny Stocks right here.
- Searching for a Fresh Perspective? Explore 27 top quantum computing companies leading the revolution in next-gen technology and shaping the future with breakthroughs in quantum algorithms, superconducting qubits, and cutting-edge research.
This article by Simply Wall St is general in nature. We provide commentary based on historical data and analyst forecasts only using an unbiased methodology and our articles are not intended to be financial advice. It does not constitute a recommendation to buy or sell any stock, and does not take account of your objectives, or your financial situation. We aim to bring you long-term focused analysis driven by fundamental data. Note that our analysis may not factor in the latest price-sensitive company announcements or qualitative material. Simply Wall St has no position in any stocks mentioned.
Valuation is complex, but we're here to simplify it.
Discover if Tarya Israel might be undervalued or overvalued with our detailed analysis, featuring fair value estimates, potential risks, dividends, insider trades, and its financial condition.
Access Free AnalysisHave feedback on this article? Concerned about the content? Get in touch with us directly. Alternatively, email editorial-team@simplywallst.com
About TASE:TRA
Excellent balance sheet with very low risk.
Market Insights

Advertisement
Community Narratives
Finding The True Value Of A Logistics Powerhouse
Fair Value US$95.21|7.5% undervalued
NV
Community Contributor
Paradigm Biopharmaceuticals Will Lead Osteoarthritis Treatment with Zilosul's FDA Success
Fair Value AU$5.50|91.8% undervalued
AM
Community Contributor
Barrick Mining (ABX:CA): A Gold Hedge against a U.S. Shutdown
Fair Value CA$60.00|26.4% undervalued
GM
Community Contributor