
Advertisement
- Israel
- /
- Food and Staples Retail
- /
- TASE:SAE
Are Robust Financials Driving The Recent Rally In Shufersal Ltd's (TLV:SAE) Stock?
Shufersal's (TLV:SAE) stock is up by a considerable 16% over the past three months. Given that the market rewards strong financials in the long-term, we wonder if that is the case in this instance. Particularly, we will be paying attention to Shufersal's ROE today.
ROE or return on equity is a useful tool to assess how effectively a company can generate returns on the investment it received from its shareholders. In simpler terms, it measures the profitability of a company in relation to shareholder's equity.
How Is ROE Calculated?
ROE can be calculated by using the formula:
Return on Equity = Net Profit (from continuing operations) ÷ Shareholders' Equity
So, based on the above formula, the ROE for Shufersal is:
19% = ₪733m ÷ ₪3.8b (Based on the trailing twelve months to March 2025).
The 'return' is the profit over the last twelve months. One way to conceptualize this is that for each ₪1 of shareholders' capital it has, the company made ₪0.19 in profit.
View our latest analysis for Shufersal
What Is The Relationship Between ROE And Earnings Growth?
So far, we've learned that ROE is a measure of a company's profitability. Depending on how much of these profits the company reinvests or "retains", and how effectively it does so, we are then able to assess a company’s earnings growth potential. Assuming all else is equal, companies that have both a higher return on equity and higher profit retention are usually the ones that have a higher growth rate when compared to companies that don't have the same features.
Shufersal's Earnings Growth And 19% ROE
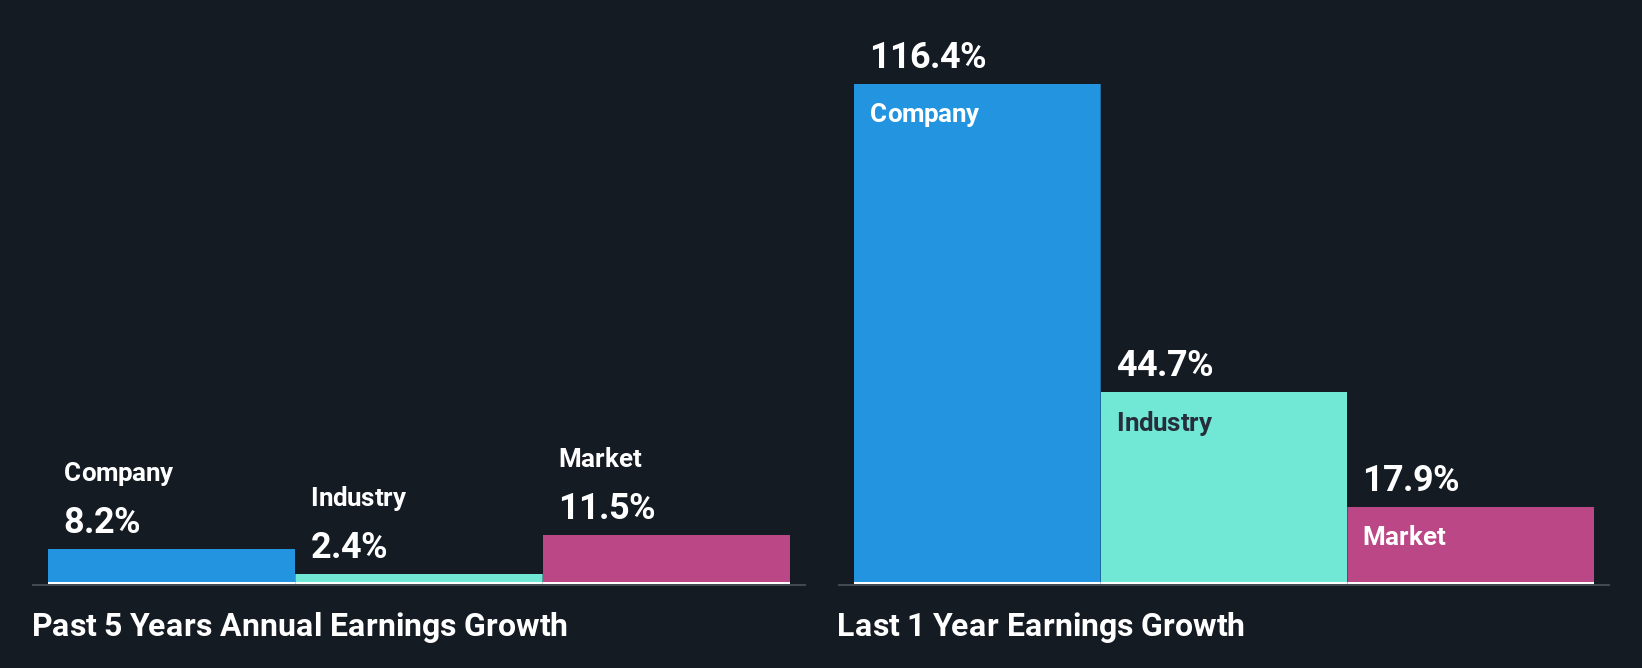
To begin with, Shufersal seems to have a respectable ROE. On comparing with the average industry ROE of 15% the company's ROE looks pretty remarkable. Probably as a result of this, Shufersal was able to see a decent growth of 8.2% over the last five years.
Next, on comparing with the industry net income growth, we found that Shufersal's growth is quite high when compared to the industry average growth of 2.4% in the same period, which is great to see.
The basis for attaching value to a company is, to a great extent, tied to its earnings growth. What investors need to determine next is if the expected earnings growth, or the lack of it, is already built into the share price. This then helps them determine if the stock is placed for a bright or bleak future. One good indicator of expected earnings growth is the P/E ratio which determines the price the market is willing to pay for a stock based on its earnings prospects. So, you may want to check if Shufersal is trading on a high P/E or a low P/E, relative to its industry.
Is Shufersal Using Its Retained Earnings Effectively?
Shufersal has a significant three-year median payout ratio of 54%, meaning that it is left with only 46% to reinvest into its business. This implies that the company has been able to achieve decent earnings growth despite returning most of its profits to shareholders.
Besides, Shufersal has been paying dividends over a period of nine years. This shows that the company is committed to sharing profits with its shareholders.
Summary
On the whole, we feel that Shufersal's performance has been quite good. We are particularly impressed by the considerable earnings growth posted by the company, which was likely backed by its high ROE. While the company is paying out most of its earnings as dividends, it has been able to grow its earnings in spite of it, so that's probably a good sign. Until now, we have only just grazed the surface of the company's past performance by looking at the company's fundamentals. You can do your own research on Shufersal and see how it has performed in the past by looking at this FREE detailed graph of past earnings, revenue and cash flows.
New: Manage All Your Stock Portfolios in One Place
We've created the ultimate portfolio companion for stock investors, and it's free.
• Connect an unlimited number of Portfolios and see your total in one currency
• Be alerted to new Warning Signs or Risks via email or mobile
• Track the Fair Value of your stocks
Have feedback on this article? Concerned about the content? Get in touch with us directly. Alternatively, email editorial-team (at) simplywallst.com.
This article by Simply Wall St is general in nature. We provide commentary based on historical data and analyst forecasts only using an unbiased methodology and our articles are not intended to be financial advice. It does not constitute a recommendation to buy or sell any stock, and does not take account of your objectives, or your financial situation. We aim to bring you long-term focused analysis driven by fundamental data. Note that our analysis may not factor in the latest price-sensitive company announcements or qualitative material. Simply Wall St has no position in any stocks mentioned.
About TASE:SAE
Shufersal
Operates a chain of supermarkets under the Shufersal brand name in Israel.
Solid track record with adequate balance sheet and pays a dividend.
Market Insights

Advertisement
Community Narratives
MINISO's fair value is projected at 26.69 with an anticipated PE ratio shift of 20x
Fair Value US$24.03|9.0% undervalued
BE
Community Contributor
Procter & Gamble: A Dividend Giant Facing Slowing Growth
Fair Value US$119.81|23.5% overvalued
AN
Community Contributor
Eli Lilly's Future Growth Driven by Tirzepatide and Favorable Market Conditions
Fair Value US$1.19k|14.4% undervalued
EA
Community Contributor