- Israel
- /
- Food and Staples Retail
- /
- TASE:HMAM
Hamama Meir Trading (1996) Ltd. (TLV:HMAM) Stock Rockets 26% As Investors Are Less Pessimistic Than Expected

Hamama Meir Trading (1996) Ltd. (TLV:HMAM) shares have continued their recent momentum with a 26% gain in the last month alone. Looking back a bit further, it's encouraging to see the stock is up 84% in the last year.
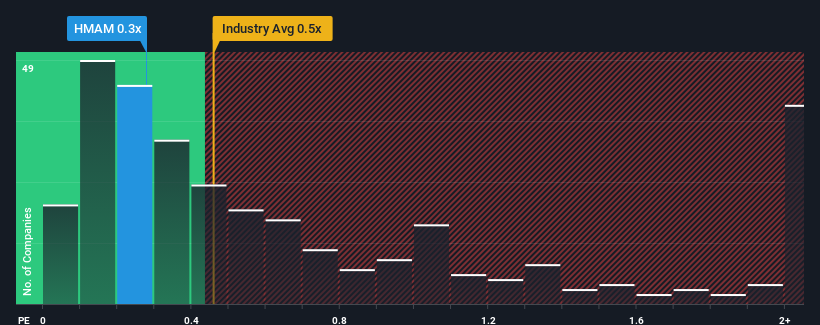
Even after such a large jump in price, it's still not a stretch to say that Hamama Meir Trading (1996)'s price-to-sales (or "P/S") ratio of 0.3x right now seems quite "middle-of-the-road" compared to the Consumer Retailing industry in Israel, where the median P/S ratio is around 0.4x. However, investors might be overlooking a clear opportunity or potential setback if there is no rational basis for the P/S.
Check out our latest analysis for Hamama Meir Trading (1996)
What Does Hamama Meir Trading (1996)'s P/S Mean For Shareholders?
For example, consider that Hamama Meir Trading (1996)'s financial performance has been poor lately as its revenue has been in decline. It might be that many expect the company to put the disappointing revenue performance behind them over the coming period, which has kept the P/S from falling. If you like the company, you'd at least be hoping this is the case so that you could potentially pick up some stock while it's not quite in favour.
Want the full picture on earnings, revenue and cash flow for the company? Then our free report on Hamama Meir Trading (1996) will help you shine a light on its historical performance.What Are Revenue Growth Metrics Telling Us About The P/S?
The only time you'd be comfortable seeing a P/S like Hamama Meir Trading (1996)'s is when the company's growth is tracking the industry closely.
In reviewing the last year of financials, we were disheartened to see the company's revenues fell to the tune of 9.2%. Unfortunately, that's brought it right back to where it started three years ago with revenue growth being virtually non-existent overall during that time. Therefore, it's fair to say that revenue growth has been inconsistent recently for the company.
This is in contrast to the rest of the industry, which is expected to grow by 13% over the next year, materially higher than the company's recent medium-term annualised growth rates.
With this information, we find it interesting that Hamama Meir Trading (1996) is trading at a fairly similar P/S compared to the industry. Apparently many investors in the company are less bearish than recent times would indicate and aren't willing to let go of their stock right now. They may be setting themselves up for future disappointment if the P/S falls to levels more in line with recent growth rates.
What Does Hamama Meir Trading (1996)'s P/S Mean For Investors?
Hamama Meir Trading (1996) appears to be back in favour with a solid price jump bringing its P/S back in line with other companies in the industry Using the price-to-sales ratio alone to determine if you should sell your stock isn't sensible, however it can be a practical guide to the company's future prospects.
We've established that Hamama Meir Trading (1996)'s average P/S is a bit surprising since its recent three-year growth is lower than the wider industry forecast. Right now we are uncomfortable with the P/S as this revenue performance isn't likely to support a more positive sentiment for long. If recent medium-term revenue trends continue, the probability of a share price decline will become quite substantial, placing shareholders at risk.
It's always necessary to consider the ever-present spectre of investment risk. We've identified 3 warning signs with Hamama Meir Trading (1996) (at least 1 which is potentially serious), and understanding them should be part of your investment process.
It's important to make sure you look for a great company, not just the first idea you come across. So if growing profitability aligns with your idea of a great company, take a peek at this free list of interesting companies with strong recent earnings growth (and a low P/E).
Valuation is complex, but we're here to simplify it.
Discover if Hamama Meir Trading (1996) might be undervalued or overvalued with our detailed analysis, featuring fair value estimates, potential risks, dividends, insider trades, and its financial condition.
Access Free AnalysisHave feedback on this article? Concerned about the content? Get in touch with us directly. Alternatively, email editorial-team (at) simplywallst.com.
This article by Simply Wall St is general in nature. We provide commentary based on historical data and analyst forecasts only using an unbiased methodology and our articles are not intended to be financial advice. It does not constitute a recommendation to buy or sell any stock, and does not take account of your objectives, or your financial situation. We aim to bring you long-term focused analysis driven by fundamental data. Note that our analysis may not factor in the latest price-sensitive company announcements or qualitative material. Simply Wall St has no position in any stocks mentioned.
About TASE:HMAM
Hamama Meir Trading (1996)
Engages in the import and distribution of raw materials for the food industry in Israel.
Excellent balance sheet with proven track record.
Market Insights

Community Narratives

