

Some say volatility, rather than debt, is the best way to think about risk as an investor, but Warren Buffett famously said that 'Volatility is far from synonymous with risk.' It's only natural to consider a company's balance sheet when you examine how risky it is, since debt is often involved when a business collapses. As with many other companies Shikun & Binui Ltd. (TLV:SKBN) makes use of debt. But the real question is whether this debt is making the company risky.
Why Does Debt Bring Risk?
Generally speaking, debt only becomes a real problem when a company can't easily pay it off, either by raising capital or with its own cash flow. Ultimately, if the company can't fulfill its legal obligations to repay debt, shareholders could walk away with nothing. However, a more common (but still painful) scenario is that it has to raise new equity capital at a low price, thus permanently diluting shareholders. Of course, debt can be an important tool in businesses, particularly capital heavy businesses. The first step when considering a company's debt levels is to consider its cash and debt together.
What Is Shikun & Binui's Net Debt?
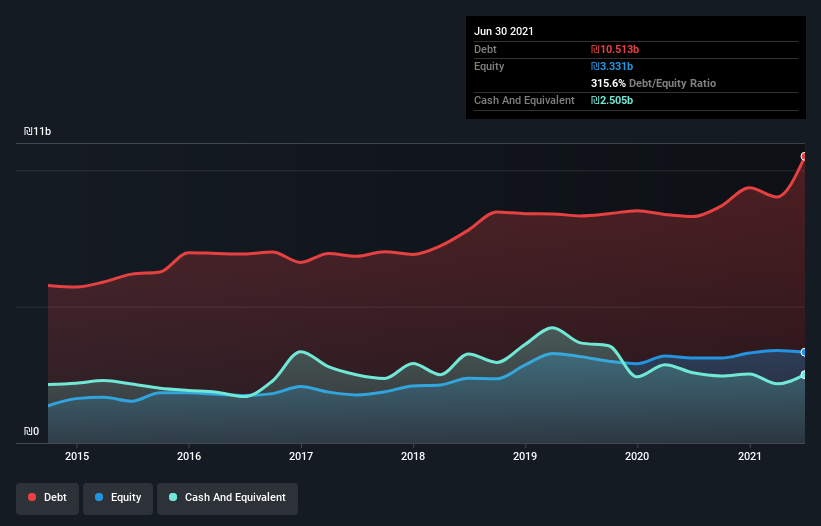
You can click the graphic below for the historical numbers, but it shows that Shikun & Binui had ₪12.9b of debt in December 2024, down from ₪14.0b, one year before. However, it does have ₪3.56b in cash offsetting this, leading to net debt of about ₪9.34b.
How Healthy Is Shikun & Binui's Balance Sheet?
The latest balance sheet data shows that Shikun & Binui had liabilities of ₪13.7b due within a year, and liabilities of ₪8.74b falling due after that. Offsetting this, it had ₪3.56b in cash and ₪3.69b in receivables that were due within 12 months. So its liabilities total ₪15.2b more than the combination of its cash and short-term receivables.
This deficit casts a shadow over the ₪6.91b company, like a colossus towering over mere mortals. So we definitely think shareholders need to watch this one closely. At the end of the day, Shikun & Binui would probably need a major re-capitalization if its creditors were to demand repayment. The balance sheet is clearly the area to focus on when you are analysing debt. But you can't view debt in total isolation; since Shikun & Binui will need earnings to service that debt. So if you're keen to discover more about its earnings, it might be worth checking out this graph of its long term earnings trend.
See our latest analysis for Shikun & Binui
Over 12 months, Shikun & Binui reported revenue of ₪8.5b, which is a gain of 9.9%, although it did not report any earnings before interest and tax. That rate of growth is a bit slow for our taste, but it takes all types to make a world.
Caveat Emptor
Over the last twelve months Shikun & Binui produced an earnings before interest and tax (EBIT) loss. To be specific the EBIT loss came in at ₪355m. Considering that alongside the liabilities mentioned above make us nervous about the company. We'd want to see some strong near-term improvements before getting too interested in the stock. Not least because it had negative free cash flow of ₪438m over the last twelve months. That means it's on the risky side of things. When analysing debt levels, the balance sheet is the obvious place to start. However, not all investment risk resides within the balance sheet - far from it. Be aware that Shikun & Binui is showing 2 warning signs in our investment analysis , and 1 of those is a bit concerning...
When all is said and done, sometimes its easier to focus on companies that don't even need debt. Readers can access a list of growth stocks with zero net debt 100% free, right now.
If you're looking to trade Shikun & Binui, open an account with the lowest-cost platform trusted by professionals, Interactive Brokers.
With clients in over 200 countries and territories, and access to 160 markets, IBKR lets you trade stocks, options, futures, forex, bonds and funds from a single integrated account.
Enjoy no hidden fees, no account minimums, and FX conversion rates as low as 0.03%, far better than what most brokers offer.
Sponsored ContentNew: Manage All Your Stock Portfolios in One Place
We've created the ultimate portfolio companion for stock investors, and it's free.
• Connect an unlimited number of Portfolios and see your total in one currency
• Be alerted to new Warning Signs or Risks via email or mobile
• Track the Fair Value of your stocks
Have feedback on this article? Concerned about the content? Get in touch with us directly. Alternatively, email editorial-team (at) simplywallst.com.
This article by Simply Wall St is general in nature. We provide commentary based on historical data and analyst forecasts only using an unbiased methodology and our articles are not intended to be financial advice. It does not constitute a recommendation to buy or sell any stock, and does not take account of your objectives, or your financial situation. We aim to bring you long-term focused analysis driven by fundamental data. Note that our analysis may not factor in the latest price-sensitive company announcements or qualitative material. Simply Wall St has no position in any stocks mentioned.
About TASE:SKBN
Shikun & Binui
Operates as an infrastructure and real estate company in Israel and internationally.
Imperfect balance sheet very low.
Similar Companies
Market Insights

Community Narratives

