
Advertisement
- Israel
- /
- Construction
- /
- TASE:LUZN
The Return Trends At Amos Luzon Development and Energy Group (TLV:LUZN) Look Promising

What are the early trends we should look for to identify a stock that could multiply in value over the long term? Typically, we'll want to notice a trend of growing return on capital employed (ROCE) and alongside that, an expanding base of capital employed. Ultimately, this demonstrates that it's a business that is reinvesting profits at increasing rates of return. Speaking of which, we noticed some great changes in Amos Luzon Development and Energy Group's (TLV:LUZN) returns on capital, so let's have a look.
Understanding Return On Capital Employed (ROCE)
If you haven't worked with ROCE before, it measures the 'return' (pre-tax profit) a company generates from capital employed in its business. The formula for this calculation on Amos Luzon Development and Energy Group is:
Return on Capital Employed = Earnings Before Interest and Tax (EBIT) ÷ (Total Assets - Current Liabilities)
0.064 = ₪72m ÷ (₪1.9b - ₪802m) (Based on the trailing twelve months to June 2023).
Thus, Amos Luzon Development and Energy Group has an ROCE of 6.4%. Even though it's in line with the industry average of 6.4%, it's still a low return by itself.
See our latest analysis for Amos Luzon Development and Energy Group
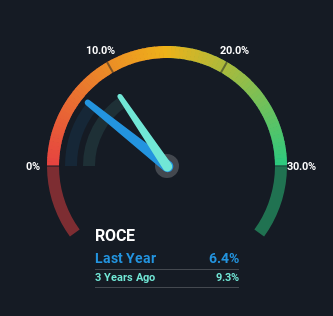
Historical performance is a great place to start when researching a stock so above you can see the gauge for Amos Luzon Development and Energy Group's ROCE against it's prior returns. If you'd like to look at how Amos Luzon Development and Energy Group has performed in the past in other metrics, you can view this free graph of past earnings, revenue and cash flow.
What Can We Tell From Amos Luzon Development and Energy Group's ROCE Trend?
Amos Luzon Development and Energy Group's ROCE growth is quite impressive. The figures show that over the last five years, ROCE has grown 131% whilst employing roughly the same amount of capital. So our take on this is that the business has increased efficiencies to generate these higher returns, all the while not needing to make any additional investments. On that front, things are looking good so it's worth exploring what management has said about growth plans going forward.
Another thing to note, Amos Luzon Development and Energy Group has a high ratio of current liabilities to total assets of 42%. This can bring about some risks because the company is basically operating with a rather large reliance on its suppliers or other sorts of short-term creditors. While it's not necessarily a bad thing, it can be beneficial if this ratio is lower.
What We Can Learn From Amos Luzon Development and Energy Group's ROCE
In summary, we're delighted to see that Amos Luzon Development and Energy Group has been able to increase efficiencies and earn higher rates of return on the same amount of capital. Since the stock has returned a staggering 302% to shareholders over the last five years, it looks like investors are recognizing these changes. Therefore, we think it would be worth your time to check if these trends are going to continue.
One more thing: We've identified 3 warning signs with Amos Luzon Development and Energy Group (at least 1 which is potentially serious) , and understanding them would certainly be useful.
If you want to search for solid companies with great earnings, check out this free list of companies with good balance sheets and impressive returns on equity.
New: Manage All Your Stock Portfolios in One Place
We've created the ultimate portfolio companion for stock investors, and it's free.
• Connect an unlimited number of Portfolios and see your total in one currency
• Be alerted to new Warning Signs or Risks via email or mobile
• Track the Fair Value of your stocks
Have feedback on this article? Concerned about the content? Get in touch with us directly. Alternatively, email editorial-team (at) simplywallst.com.
This article by Simply Wall St is general in nature. We provide commentary based on historical data and analyst forecasts only using an unbiased methodology and our articles are not intended to be financial advice. It does not constitute a recommendation to buy or sell any stock, and does not take account of your objectives, or your financial situation. We aim to bring you long-term focused analysis driven by fundamental data. Note that our analysis may not factor in the latest price-sensitive company announcements or qualitative material. Simply Wall St has no position in any stocks mentioned.
About TASE:LUZN
Amos Luzon Development and Energy Group
Engages in the real estate development and construction business in Israel and internationally.
Mediocre balance sheet and overvalued.
Market Insights

Advertisement
Community Narratives
WhiteCap Is Positioned To Profit Regardless Of Trump's Policy 
Fair Value CA$22.60|61.6% undervalued
ST
Equity Analyst and Writer
Microsoft's Evolution Will Drive Revenue to New Heights Fueled by AI
Fair Value US$360.00|28.3% overvalued
BR
Community Contributor
A CASE FOR USD$2.50 (CAD$3.44) BY 2028 (A 5-10 BAGGER)
Fair Value CA$3.44|87.8% undervalued
AG
Community Contributor