
Advertisement
The external fund manager backed by Berkshire Hathaway's Charlie Munger, Li Lu, makes no bones about it when he says 'The biggest investment risk is not the volatility of prices, but whether you will suffer a permanent loss of capital.' So it might be obvious that you need to consider debt, when you think about how risky any given stock is, because too much debt can sink a company. We can see that C. Mer Industries Ltd. (TLV:CMER) does use debt in its business. But the more important question is: how much risk is that debt creating?
Why Does Debt Bring Risk?
Debt and other liabilities become risky for a business when it cannot easily fulfill those obligations, either with free cash flow or by raising capital at an attractive price. In the worst case scenario, a company can go bankrupt if it cannot pay its creditors. However, a more common (but still painful) scenario is that it has to raise new equity capital at a low price, thus permanently diluting shareholders. Having said that, the most common situation is where a company manages its debt reasonably well - and to its own advantage. The first step when considering a company's debt levels is to consider its cash and debt together.
See our latest analysis for C. Mer Industries
What Is C. Mer Industries's Debt?
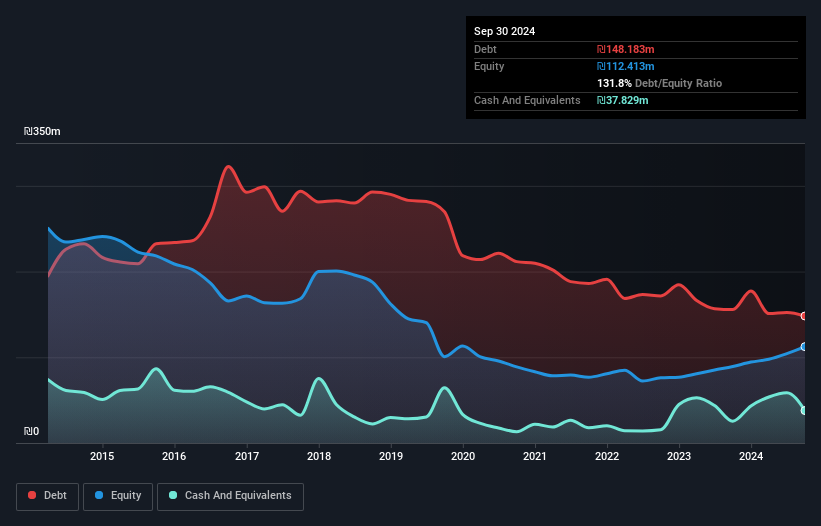
The image below, which you can click on for greater detail, shows that C. Mer Industries had debt of ₪148.2m at the end of September 2024, a reduction from ₪155.6m over a year. On the flip side, it has ₪37.8m in cash leading to net debt of about ₪110.4m.
How Healthy Is C. Mer Industries' Balance Sheet?
Zooming in on the latest balance sheet data, we can see that C. Mer Industries had liabilities of ₪340.5m due within 12 months and liabilities of ₪65.1m due beyond that. On the other hand, it had cash of ₪37.8m and ₪296.9m worth of receivables due within a year. So its liabilities outweigh the sum of its cash and (near-term) receivables by ₪70.8m.
Given C. Mer Industries has a market capitalization of ₪537.3m, it's hard to believe these liabilities pose much threat. But there are sufficient liabilities that we would certainly recommend shareholders continue to monitor the balance sheet, going forward.
We measure a company's debt load relative to its earnings power by looking at its net debt divided by its earnings before interest, tax, depreciation, and amortization (EBITDA) and by calculating how easily its earnings before interest and tax (EBIT) cover its interest expense (interest cover). The advantage of this approach is that we take into account both the absolute quantum of debt (with net debt to EBITDA) and the actual interest expenses associated with that debt (with its interest cover ratio).
C. Mer Industries has net debt worth 2.1 times EBITDA, which isn't too much, but its interest cover looks a bit on the low side, with EBIT at only 4.0 times the interest expense. While these numbers do not alarm us, it's worth noting that the cost of the company's debt is having a real impact. Importantly, C. Mer Industries grew its EBIT by 51% over the last twelve months, and that growth will make it easier to handle its debt. There's no doubt that we learn most about debt from the balance sheet. But it is C. Mer Industries's earnings that will influence how the balance sheet holds up in the future. So when considering debt, it's definitely worth looking at the earnings trend. Click here for an interactive snapshot.
But our final consideration is also important, because a company cannot pay debt with paper profits; it needs cold hard cash. So it's worth checking how much of that EBIT is backed by free cash flow. Over the last three years, C. Mer Industries recorded free cash flow worth a fulsome 87% of its EBIT, which is stronger than we'd usually expect. That positions it well to pay down debt if desirable to do so.
Our View
Happily, C. Mer Industries's impressive conversion of EBIT to free cash flow implies it has the upper hand on its debt. But truth be told we feel its interest cover does undermine this impression a bit. Zooming out, C. Mer Industries seems to use debt quite reasonably; and that gets the nod from us. After all, sensible leverage can boost returns on equity. When analysing debt levels, the balance sheet is the obvious place to start. But ultimately, every company can contain risks that exist outside of the balance sheet. For example - C. Mer Industries has 1 warning sign we think you should be aware of.
Of course, if you're the type of investor who prefers buying stocks without the burden of debt, then don't hesitate to discover our exclusive list of net cash growth stocks, today.
New: AI Stock Screener & Alerts
Our new AI Stock Screener scans the market every day to uncover opportunities.
• Dividend Powerhouses (3%+ Yield)
• Undervalued Small Caps with Insider Buying
• High growth Tech and AI Companies
Or build your own from over 50 metrics.
Have feedback on this article? Concerned about the content? Get in touch with us directly. Alternatively, email editorial-team (at) simplywallst.com.
This article by Simply Wall St is general in nature. We provide commentary based on historical data and analyst forecasts only using an unbiased methodology and our articles are not intended to be financial advice. It does not constitute a recommendation to buy or sell any stock, and does not take account of your objectives, or your financial situation. We aim to bring you long-term focused analysis driven by fundamental data. Note that our analysis may not factor in the latest price-sensitive company announcements or qualitative material. Simply Wall St has no position in any stocks mentioned.
About TASE:CMER
C. Mer Industries
Provides solutions in the areas of homeland security (HLS), communication infrastructure, and defense technologies.
Solid track record with excellent balance sheet.
Similar Companies
Market Insights

Advertisement
Community Narratives
MINISO's fair value is projected at 26.69 with an anticipated PE ratio shift of 20x
Fair Value US$24.03|11.0% undervalued
BE
Community Contributor
Procter & Gamble: A Dividend Giant Facing Slowing Growth
Fair Value US$119.81|23.3% overvalued
AN
Community Contributor
Eli Lilly's Future Growth Driven by Tirzepatide and Favorable Market Conditions
Fair Value US$1.19k|13.8% undervalued
EA
Community Contributor