
Advertisement
- Israel
- /
- Construction
- /
- TASE:BRAN
Baran Group Ltd's (TLV:BRAN) Stock On An Uptrend: Could Fundamentals Be Driving The Momentum?
Baran Group (TLV:BRAN) has had a great run on the share market with its stock up by a significant 43% over the last three months. Given that stock prices are usually aligned with a company's financial performance in the long-term, we decided to study its financial indicators more closely to see if they had a hand to play in the recent price move. In this article, we decided to focus on Baran Group's ROE.
Return on Equity or ROE is a test of how effectively a company is growing its value and managing investors’ money. In short, ROE shows the profit each dollar generates with respect to its shareholder investments.
How Is ROE Calculated?
The formula for ROE is:
Return on Equity = Net Profit (from continuing operations) ÷ Shareholders' Equity
So, based on the above formula, the ROE for Baran Group is:
11% = ₪31m ÷ ₪288m (Based on the trailing twelve months to September 2025).
The 'return' refers to a company's earnings over the last year. One way to conceptualize this is that for each ₪1 of shareholders' capital it has, the company made ₪0.11 in profit.
See our latest analysis for Baran Group
Why Is ROE Important For Earnings Growth?
We have already established that ROE serves as an efficient profit-generating gauge for a company's future earnings. We now need to evaluate how much profit the company reinvests or "retains" for future growth which then gives us an idea about the growth potential of the company. Generally speaking, other things being equal, firms with a high return on equity and profit retention, have a higher growth rate than firms that don’t share these attributes.
Baran Group's Earnings Growth And 11% ROE
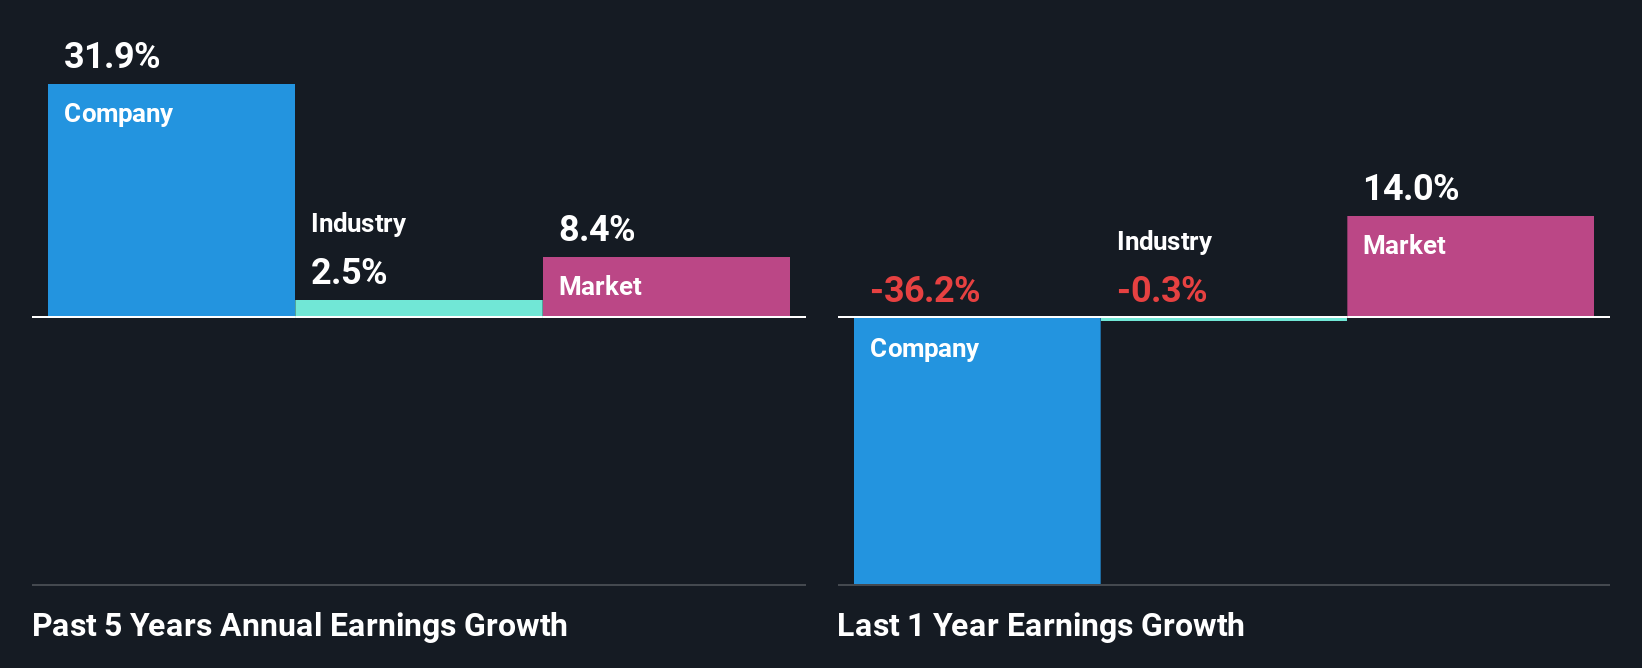
When you first look at it, Baran Group's ROE doesn't look that attractive. However, the fact that the company's ROE is higher than the average industry ROE of 6.8%, is definitely interesting. Even more so after seeing Baran Group's exceptional 32% net income growth over the past five years. Bear in mind, the company does have a moderately low ROE. It is just that the industry ROE is lower. So, there might well be other reasons for the earnings to grow. For example, it is possible that the broader industry is going through a high growth phase, or that the company has a low payout ratio.
We then compared Baran Group's net income growth with the industry and we're pleased to see that the company's growth figure is higher when compared with the industry which has a growth rate of 2.5% in the same 5-year period.
The basis for attaching value to a company is, to a great extent, tied to its earnings growth. It’s important for an investor to know whether the market has priced in the company's expected earnings growth (or decline). This then helps them determine if the stock is placed for a bright or bleak future. One good indicator of expected earnings growth is the P/E ratio which determines the price the market is willing to pay for a stock based on its earnings prospects. So, you may want to check if Baran Group is trading on a high P/E or a low P/E, relative to its industry.
Is Baran Group Efficiently Re-investing Its Profits?
The high three-year median payout ratio of 87% (implying that it keeps only 13% of profits) for Baran Group suggests that the company's growth wasn't really hampered despite it returning most of the earnings to its shareholders.
While Baran Group has seen growth in its earnings, it only recently started to pay a dividend. It is most likely that the company decided to impress new and existing shareholders with a dividend.
Conclusion
Overall, we feel that Baran Group certainly does have some positive factors to consider. Namely, its significant earnings growth, to which its moderate rate of return likely contributed. While the company is paying out most of its earnings as dividends, it has been able to grow its earnings in spite of it, so that's probably a good sign. Until now, we have only just grazed the surface of the company's past performance by looking at the company's fundamentals. To gain further insights into Baran Group's past profit growth, check out this visualization of past earnings, revenue and cash flows.
Valuation is complex, but we're here to simplify it.
Discover if Baran Group might be undervalued or overvalued with our detailed analysis, featuring fair value estimates, potential risks, dividends, insider trades, and its financial condition.
Access Free AnalysisHave feedback on this article? Concerned about the content? Get in touch with us directly. Alternatively, email editorial-team (at) simplywallst.com.
This article by Simply Wall St is general in nature. We provide commentary based on historical data and analyst forecasts only using an unbiased methodology and our articles are not intended to be financial advice. It does not constitute a recommendation to buy or sell any stock, and does not take account of your objectives, or your financial situation. We aim to bring you long-term focused analysis driven by fundamental data. Note that our analysis may not factor in the latest price-sensitive company announcements or qualitative material. Simply Wall St has no position in any stocks mentioned.
About TASE:BRAN
Baran Group
An engineering company, provides engineering solutions for projects in Israel and internationally.
Moderate risk second-rate dividend payer.
Similar Companies
Market Insights

Advertisement
Community Narratives
MicroVision will explode future revenue by 380.37% with a vision towards success
Fair Value US$60|98.4% undervalued
TH
Community Contributor
The Indispensable Artery for a New North American Economy
Fair Value CA$132.87|0.8% undervalued
TI
Community Contributor
Recently Updated Narratives
CO

composite32 on TAV Havalimanlari Holding ·
TAV Havalimanlari Holding will fly high with 25.68% revenue growth
Fair Value:₺545.1648.6% undervalued
3 followersusers have followed this narrative
0 commentsusers have commented on this narrative
0 likesusers have liked this narrative
RO


Robbo on Fiducian Group ·
Fiducian: Compliance Clouds or Value Opportunity?
Fair Value:AU$122.3% overvalued
1 followerusers have followed this narrative
0 commentsusers have commented on this narrative
0 likesusers have liked this narrative
MA


MarkoVT on COVER ·
Q3 Outlook modestly optimistic
Fair Value:JP¥1.65k2.0% overvalued
1 followerusers have followed this narrative
0 commentsusers have commented on this narrative
0 likesusers have liked this narrative
Popular Narratives
TH

TheWallstreetKing on MicroVision ·
MicroVision will explode future revenue by 380.37% with a vision towards success
Fair Value:US$6098.4% undervalued
93 followersusers have followed this narrative
10 commentsusers have commented on this narrative
18 likesusers have liked this narrative
OS


oscargarcia on Alphabet ·
The company that turned a verb into a global necessity and basically runs the modern internet, digital ads, smartphones, maps, and AI.
Fair Value:US$3405.9% undervalued
136 followersusers have followed this narrative
6 commentsusers have commented on this narrative
18 likesusers have liked this narrative
AN


AnalystConsensusTarget on NVIDIA ·
NVDA: Expanding AI Demand Will Drive Major Data Center Investments Through 2026
Fair Value:US$232.7922.6% undervalued
929 followersusers have followed this narrative
6 commentsusers have commented on this narrative
22 likesusers have liked this narrative