Stock Analysis
Investing in OTP Bank Nyrt (BUSE:OTP) a year ago would have delivered you a 68% gain


These days it's easy to simply buy an index fund, and your returns should (roughly) match the market. But one can do better than that by picking better than average stocks (as part of a diversified portfolio). To wit, the OTP Bank Nyrt. (BUSE:OTP) share price is 63% higher than it was a year ago, much better than the market return of around 44% (not including dividends) in the same period. So that should have shareholders smiling. However, the stock hasn't done so well in the longer term, with the stock only up 14% in three years.
Let's take a look at the underlying fundamentals over the longer term, and see if they've been consistent with shareholders returns.
Check out our latest analysis for OTP Bank Nyrt
In his essay The Superinvestors of Graham-and-Doddsville Warren Buffett described how share prices do not always rationally reflect the value of a business. One flawed but reasonable way to assess how sentiment around a company has changed is to compare the earnings per share (EPS) with the share price.
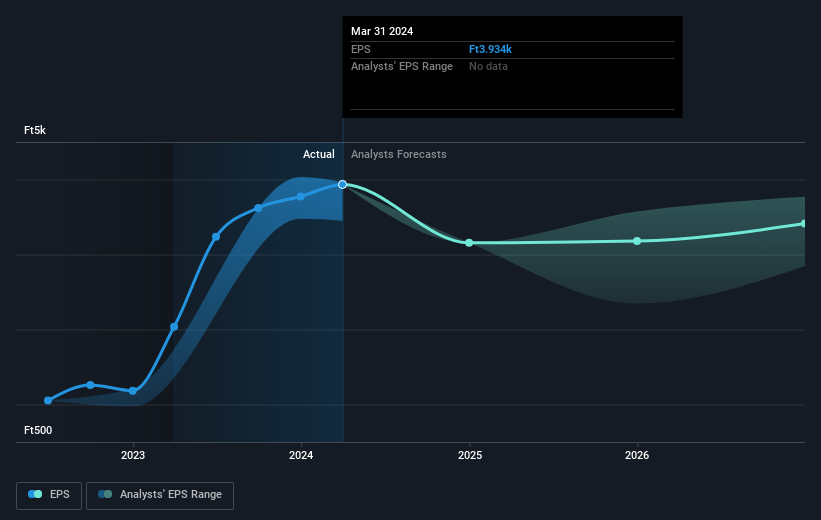
During the last year OTP Bank Nyrt grew its earnings per share (EPS) by 93%. This EPS growth is significantly higher than the 63% increase in the share price. Therefore, it seems the market isn't as excited about OTP Bank Nyrt as it was before. This could be an opportunity. This cautious sentiment is reflected in its (fairly low) P/E ratio of 4.76.
You can see how EPS has changed over time in the image below (click on the chart to see the exact values).
We know that OTP Bank Nyrt has improved its bottom line over the last three years, but what does the future have in store? If you are thinking of buying or selling OTP Bank Nyrt stock, you should check out this FREE detailed report on its balance sheet.
What About Dividends?
It is important to consider the total shareholder return, as well as the share price return, for any given stock. The TSR incorporates the value of any spin-offs or discounted capital raisings, along with any dividends, based on the assumption that the dividends are reinvested. It's fair to say that the TSR gives a more complete picture for stocks that pay a dividend. As it happens, OTP Bank Nyrt's TSR for the last 1 year was 68%, which exceeds the share price return mentioned earlier. And there's no prize for guessing that the dividend payments largely explain the divergence!
A Different Perspective
We're pleased to report that OTP Bank Nyrt shareholders have received a total shareholder return of 68% over one year. That's including the dividend. Since the one-year TSR is better than the five-year TSR (the latter coming in at 10% per year), it would seem that the stock's performance has improved in recent times. Given the share price momentum remains strong, it might be worth taking a closer look at the stock, lest you miss an opportunity. It's always interesting to track share price performance over the longer term. But to understand OTP Bank Nyrt better, we need to consider many other factors. Case in point: We've spotted 2 warning signs for OTP Bank Nyrt you should be aware of, and 1 of them can't be ignored.
Of course OTP Bank Nyrt may not be the best stock to buy. So you may wish to see this free collection of growth stocks.
Please note, the market returns quoted in this article reflect the market weighted average returns of stocks that currently trade on Hungarian exchanges.
Valuation is complex, but we're helping make it simple.
Find out whether OTP Bank Nyrt is potentially over or undervalued by checking out our comprehensive analysis, which includes fair value estimates, risks and warnings, dividends, insider transactions and financial health.
View the Free AnalysisHave feedback on this article? Concerned about the content? Get in touch with us directly. Alternatively, email editorial-team (at) simplywallst.com.
This article by Simply Wall St is general in nature. We provide commentary based on historical data and analyst forecasts only using an unbiased methodology and our articles are not intended to be financial advice. It does not constitute a recommendation to buy or sell any stock, and does not take account of your objectives, or your financial situation. We aim to bring you long-term focused analysis driven by fundamental data. Note that our analysis may not factor in the latest price-sensitive company announcements or qualitative material. Simply Wall St has no position in any stocks mentioned.
About BUSE:OTP
OTP Bank Nyrt
Engages in the provision of commercial banking services to individuals, municipalities, corporations, and enterprises.
Undervalued with solid track record and pays a dividend.
