
Advertisement
There's Been No Shortage Of Growth Recently For Varteks d.d's (ZGSE:VART) Returns On Capital

Did you know there are some financial metrics that can provide clues of a potential multi-bagger? Typically, we'll want to notice a trend of growing return on capital employed (ROCE) and alongside that, an expanding base of capital employed. This shows us that it's a compounding machine, able to continually reinvest its earnings back into the business and generate higher returns. So on that note, Varteks d.d (ZGSE:VART) looks quite promising in regards to its trends of return on capital.
What is Return On Capital Employed (ROCE)?
For those that aren't sure what ROCE is, it measures the amount of pre-tax profits a company can generate from the capital employed in its business. Analysts use this formula to calculate it for Varteks d.d:
Return on Capital Employed = Earnings Before Interest and Tax (EBIT) ÷ (Total Assets - Current Liabilities)
0.018 = Kn3.2m ÷ (Kn310m - Kn130m) (Based on the trailing twelve months to December 2021).
Thus, Varteks d.d has an ROCE of 1.8%. Ultimately, that's a low return and it under-performs the Luxury industry average of 11%.
Check out our latest analysis for Varteks d.d
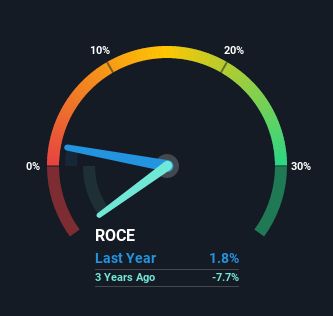
Historical performance is a great place to start when researching a stock so above you can see the gauge for Varteks d.d's ROCE against it's prior returns. If you'd like to look at how Varteks d.d has performed in the past in other metrics, you can view this free graph of past earnings, revenue and cash flow.
What Does the ROCE Trend For Varteks d.d Tell Us?
Like most people, we're pleased that Varteks d.d is now generating some pretax earnings. The company was generating losses five years ago, but now it's turned around, earning 1.8% which is no doubt a relief for some early shareholders. Additionally, the business is utilizing 47% less capital than it was five years ago, and taken at face value, that can mean the company needs less funds at work to get a return. This could potentially mean that the company is selling some of its assets.
For the record though, there was a noticeable increase in the company's current liabilities over the period, so we would attribute some of the ROCE growth to that. Effectively this means that suppliers or short-term creditors are now funding 42% of the business, which is more than it was five years ago. Given it's pretty high ratio, we'd remind investors that having current liabilities at those levels can bring about some risks in certain businesses.
Our Take On Varteks d.d's ROCE
In a nutshell, we're pleased to see that Varteks d.d has been able to generate higher returns from less capital. However the stock is down a substantial 73% in the last five years so there could be other areas of the business hurting its prospects. Regardless, we think the underlying fundamentals warrant this stock for further investigation.
Since virtually every company faces some risks, it's worth knowing what they are, and we've spotted 5 warning signs for Varteks d.d (of which 4 are a bit concerning!) that you should know about.
While Varteks d.d isn't earning the highest return, check out this free list of companies that are earning high returns on equity with solid balance sheets.
New: Manage All Your Stock Portfolios in One Place
We've created the ultimate portfolio companion for stock investors, and it's free.
• Connect an unlimited number of Portfolios and see your total in one currency
• Be alerted to new Warning Signs or Risks via email or mobile
• Track the Fair Value of your stocks
Have feedback on this article? Concerned about the content? Get in touch with us directly. Alternatively, email editorial-team (at) simplywallst.com.
This article by Simply Wall St is general in nature. We provide commentary based on historical data and analyst forecasts only using an unbiased methodology and our articles are not intended to be financial advice. It does not constitute a recommendation to buy or sell any stock, and does not take account of your objectives, or your financial situation. We aim to bring you long-term focused analysis driven by fundamental data. Note that our analysis may not factor in the latest price-sensitive company announcements or qualitative material. Simply Wall St has no position in any stocks mentioned.
About ZGSE:VART
Varteks d.d
Manufactures and sells clothes for men and women in Croatia and internationally.
Slightly overvalued with weak fundamentals.
Market Insights


Advertisement
Community Narratives
For the Emperor: Why Games Workshop Could Be a Star Investment
Fair Value UK£160.00|0.4% overvalued
RO
Community Contributor
Securitas will boost margins with AI and tech-driven services
Fair Value SEK 260.91|44.5% undervalued
UN
Community Contributor
A Leader in EV Charging with Growth Potential
Fair Value €27.00|17.8% undervalued
TI
Community Contributor