

Today we'll do a simple run through of a valuation method used to estimate the attractiveness of Varteks d.d. (ZGSE:VART) as an investment opportunity by projecting its future cash flows and then discounting them to today's value. The Discounted Cash Flow (DCF) model is the tool we will apply to do this. Before you think you won't be able to understand it, just read on! It's actually much less complex than you'd imagine.
We generally believe that a company's value is the present value of all of the cash it will generate in the future. However, a DCF is just one valuation metric among many, and it is not without flaws. If you want to learn more about discounted cash flow, the rationale behind this calculation can be read in detail in the Simply Wall St analysis model.
View our latest analysis for Varteks d.d
The method
We are going to use a two-stage DCF model, which, as the name states, takes into account two stages of growth. The first stage is generally a higher growth period which levels off heading towards the terminal value, captured in the second 'steady growth' period. In the first stage we need to estimate the cash flows to the business over the next ten years. Seeing as no analyst estimates of free cash flow are available to us, we have extrapolate the previous free cash flow (FCF) from the company's last reported value. We assume companies with shrinking free cash flow will slow their rate of shrinkage, and that companies with growing free cash flow will see their growth rate slow, over this period. We do this to reflect that growth tends to slow more in the early years than it does in later years.
A DCF is all about the idea that a dollar in the future is less valuable than a dollar today, so we discount the value of these future cash flows to their estimated value in today's dollars:
10-year free cash flow (FCF) forecast
| 2021 | 2022 | 2023 | 2024 | 2025 | 2026 | 2027 | 2028 | 2029 | 2030 | |
| Levered FCF (HRK, Millions) | Kn5.30m | Kn6.46m | Kn7.49m | Kn8.39m | Kn9.16m | Kn9.82m | Kn10.4m | Kn10.9m | Kn11.3m | Kn11.7m |
| Growth Rate Estimate Source | Est @ 30.09% | Est @ 21.82% | Est @ 16.03% | Est @ 11.98% | Est @ 9.15% | Est @ 7.16% | Est @ 5.77% | Est @ 4.8% | Est @ 4.12% | Est @ 3.64% |
| Present Value (HRK, Millions) Discounted @ 26% | Kn4.2 | Kn4.1 | Kn3.8 | Kn3.4 | Kn2.9 | Kn2.5 | Kn2.1 | Kn1.8 | Kn1.5 | Kn1.2 |
("Est" = FCF growth rate estimated by Simply Wall St)
Present Value of 10-year Cash Flow (PVCF) = Kn27m
The second stage is also known as Terminal Value, this is the business's cash flow after the first stage. The Gordon Growth formula is used to calculate Terminal Value at a future annual growth rate equal to the 5-year average of the 10-year government bond yield of 2.5%. We discount the terminal cash flows to today's value at a cost of equity of 26%.
Terminal Value (TV)= FCF2030 × (1 + g) ÷ (r – g) = Kn12m× (1 + 2.5%) ÷ (26%– 2.5%) = Kn52m
Present Value of Terminal Value (PVTV)= TV / (1 + r)10= Kn52m÷ ( 1 + 26%)10= Kn5.4m
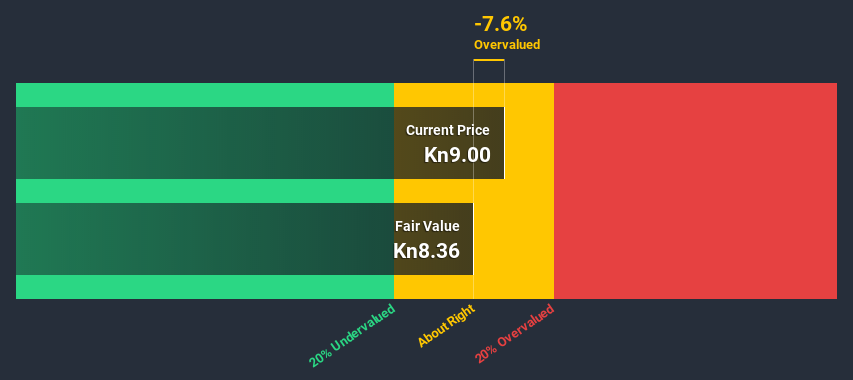
The total value, or equity value, is then the sum of the present value of the future cash flows, which in this case is Kn32m. To get the intrinsic value per share, we divide this by the total number of shares outstanding. Relative to the current share price of Kn9.0, the company appears around fair value at the time of writing. Remember though, that this is just an approximate valuation, and like any complex formula - garbage in, garbage out.
The assumptions
We would point out that the most important inputs to a discounted cash flow are the discount rate and of course the actual cash flows. You don't have to agree with these inputs, I recommend redoing the calculations yourself and playing with them. The DCF also does not consider the possible cyclicality of an industry, or a company's future capital requirements, so it does not give a full picture of a company's potential performance. Given that we are looking at Varteks d.d as potential shareholders, the cost of equity is used as the discount rate, rather than the cost of capital (or weighted average cost of capital, WACC) which accounts for debt. In this calculation we've used 26%, which is based on a levered beta of 2.000. Beta is a measure of a stock's volatility, compared to the market as a whole. We get our beta from the industry average beta of globally comparable companies, with an imposed limit between 0.8 and 2.0, which is a reasonable range for a stable business.
Moving On:
Valuation is only one side of the coin in terms of building your investment thesis, and it shouldn't be the only metric you look at when researching a company. It's not possible to obtain a foolproof valuation with a DCF model. Instead the best use for a DCF model is to test certain assumptions and theories to see if they would lead to the company being undervalued or overvalued. If a company grows at a different rate, or if its cost of equity or risk free rate changes sharply, the output can look very different. For Varteks d.d, we've put together three relevant factors you should further research:
- Risks: As an example, we've found 2 warning signs for Varteks d.d (1 makes us a bit uncomfortable!) that you need to consider before investing here.
- Other High Quality Alternatives: Do you like a good all-rounder? Explore our interactive list of high quality stocks to get an idea of what else is out there you may be missing!
- Other Top Analyst Picks: Interested to see what the analysts are thinking? Take a look at our interactive list of analysts' top stock picks to find out what they feel might have an attractive future outlook!
PS. The Simply Wall St app conducts a discounted cash flow valuation for every stock on the ZGSE every day. If you want to find the calculation for other stocks just search here.
When trading Varteks d.d or any other investment, use the platform considered by many to be the Professional's Gateway to the Worlds Market, Interactive Brokers. You get the lowest-cost* trading on stocks, options, futures, forex, bonds and funds worldwide from a single integrated account. Promoted
New: Manage All Your Stock Portfolios in One Place
We've created the ultimate portfolio companion for stock investors, and it's free.
• Connect an unlimited number of Portfolios and see your total in one currency
• Be alerted to new Warning Signs or Risks via email or mobile
• Track the Fair Value of your stocks
This article by Simply Wall St is general in nature. It does not constitute a recommendation to buy or sell any stock, and does not take account of your objectives, or your financial situation. We aim to bring you long-term focused analysis driven by fundamental data. Note that our analysis may not factor in the latest price-sensitive company announcements or qualitative material. Simply Wall St has no position in any stocks mentioned.
*Interactive Brokers Rated Lowest Cost Broker by StockBrokers.com Annual Online Review 2020
Have feedback on this article? Concerned about the content? Get in touch with us directly. Alternatively, email editorial-team@simplywallst.com.
About ZGSE:VART
Varteks d.d
Manufactures and sells clothes for men and women in Croatia and internationally.
Slightly overvalued with weak fundamentals.

