
Advertisement
- Hong Kong
- /
- Renewable Energy
- /
- SEHK:412
Shandong Hi-Speed Holdings Group Limited's (HKG:412) Stock Retreats 29% But Revenues Haven't Escaped The Attention Of Investors
Shandong Hi-Speed Holdings Group Limited (HKG:412) shares have had a horrible month, losing 29% after a relatively good period beforehand. Of course, over the longer-term many would still wish they owned shares as the stock's price has soared 123% in the last twelve months.
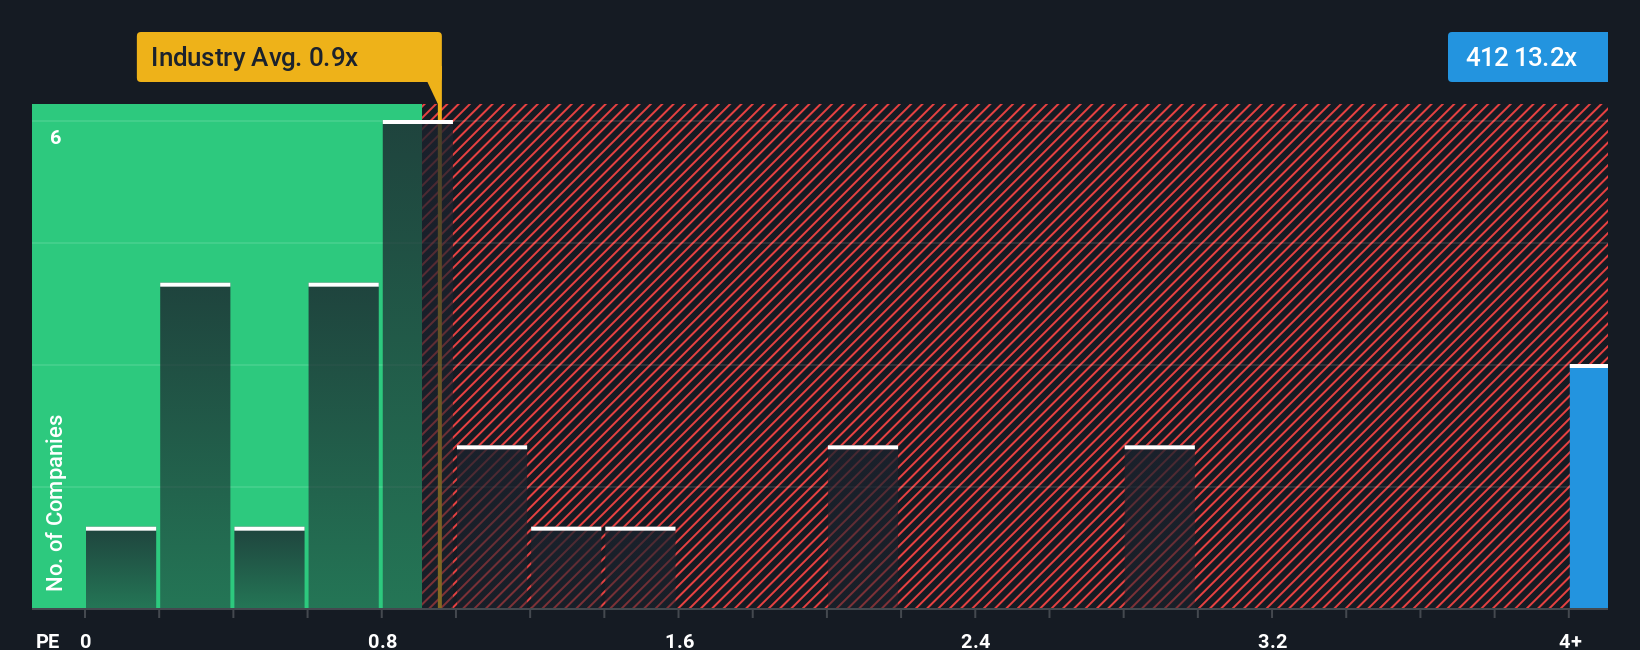
In spite of the heavy fall in price, you could still be forgiven for thinking Shandong Hi-Speed Holdings Group is a stock to steer clear of with a price-to-sales ratios (or "P/S") of 13.2x, considering almost half the companies in Hong Kong's Renewable Energy industry have P/S ratios below 0.9x. Nonetheless, we'd need to dig a little deeper to determine if there is a rational basis for the highly elevated P/S.
See our latest analysis for Shandong Hi-Speed Holdings Group
How Has Shandong Hi-Speed Holdings Group Performed Recently?
With its revenue growth in positive territory compared to the declining revenue of most other companies, Shandong Hi-Speed Holdings Group has been doing quite well of late. Perhaps the market is expecting the company's future revenue growth to buck the trend of the industry, contributing to a higher P/S. You'd really hope so, otherwise you're paying a pretty hefty price for no particular reason.
Keen to find out how analysts think Shandong Hi-Speed Holdings Group's future stacks up against the industry? In that case, our free report is a great place to start.How Is Shandong Hi-Speed Holdings Group's Revenue Growth Trending?
There's an inherent assumption that a company should far outperform the industry for P/S ratios like Shandong Hi-Speed Holdings Group's to be considered reasonable.
Taking a look back first, we see that there was hardly any revenue growth to speak of for the company over the past year. Although pleasingly revenue has lifted 253% in aggregate from three years ago, notwithstanding the last 12 months. Therefore, it's fair to say the revenue growth recently has been great for the company, but investors will want to ask why it has slowed to such an extent.
Turning to the outlook, the next year should generate growth of 23% as estimated by the dual analysts watching the company. Meanwhile, the rest of the industry is forecast to only expand by 8.8%, which is noticeably less attractive.
With this in mind, it's not hard to understand why Shandong Hi-Speed Holdings Group's P/S is high relative to its industry peers. Apparently shareholders aren't keen to offload something that is potentially eyeing a more prosperous future.
The Key Takeaway
Even after such a strong price drop, Shandong Hi-Speed Holdings Group's P/S still exceeds the industry median significantly. Using the price-to-sales ratio alone to determine if you should sell your stock isn't sensible, however it can be a practical guide to the company's future prospects.
As we suspected, our examination of Shandong Hi-Speed Holdings Group's analyst forecasts revealed that its superior revenue outlook is contributing to its high P/S. At this stage investors feel the potential for a deterioration in revenues is quite remote, justifying the elevated P/S ratio. Unless the analysts have really missed the mark, these strong revenue forecasts should keep the share price buoyant.
It's always necessary to consider the ever-present spectre of investment risk. We've identified 3 warning signs with Shandong Hi-Speed Holdings Group (at least 2 which are a bit concerning), and understanding them should be part of your investment process.
If strong companies turning a profit tickle your fancy, then you'll want to check out this free list of interesting companies that trade on a low P/E (but have proven they can grow earnings).
New: Manage All Your Stock Portfolios in One Place
We've created the ultimate portfolio companion for stock investors, and it's free.
• Connect an unlimited number of Portfolios and see your total in one currency
• Be alerted to new Warning Signs or Risks via email or mobile
• Track the Fair Value of your stocks
Have feedback on this article? Concerned about the content? Get in touch with us directly. Alternatively, email editorial-team (at) simplywallst.com.
This article by Simply Wall St is general in nature. We provide commentary based on historical data and analyst forecasts only using an unbiased methodology and our articles are not intended to be financial advice. It does not constitute a recommendation to buy or sell any stock, and does not take account of your objectives, or your financial situation. We aim to bring you long-term focused analysis driven by fundamental data. Note that our analysis may not factor in the latest price-sensitive company announcements or qualitative material. Simply Wall St has no position in any stocks mentioned.
About SEHK:412
Shandong Hi-Speed Holdings Group
An investment holding company, operates photovoltaic and wind power plants in the People’s Republic of China.
Slight risk with questionable track record.
Similar Companies
Market Insights

Advertisement
Community Narratives
MicroVision will explode future revenue by 380.37% with a vision towards success
Fair Value US$60|98.4% undervalued
TH
Community Contributor
The Indispensable Artery for a New North American Economy
Fair Value CA$132.87|0.6% undervalued
TI
Community Contributor
Recently Updated Narratives
JO


JohnJ on Worldline ·
No miracle in sight
Fair Value:€7.0178.0% undervalued
8 followersusers have followed this narrative
0 commentsusers have commented on this narrative
0 likesusers have liked this narrative
MA


MarkoVT on COVER ·
Q3 Outlook modestly optimistic
Fair Value:JP¥1.65k2.0% overvalued
1 followerusers have followed this narrative
0 commentsusers have commented on this narrative
0 likesusers have liked this narrative
BL


BlackGoat on Alphabet ·
Alphabet: The Under-appreciated Compounder Hiding in Plain Sight
Fair Value:US$324.481.3% undervalued
79 followersusers have followed this narrative
3 commentsusers have commented on this narrative
1 likeusers have liked this narrative
Popular Narratives
OS

oscargarcia on Alphabet ·
The company that turned a verb into a global necessity and basically runs the modern internet, digital ads, smartphones, maps, and AI.
Fair Value:US$3405.9% undervalued
136 followersusers have followed this narrative
6 commentsusers have commented on this narrative
18 likesusers have liked this narrative
TH

TheWallstreetKing on MicroVision ·
MicroVision will explode future revenue by 380.37% with a vision towards success
Fair Value:US$6098.4% undervalued
90 followersusers have followed this narrative
10 commentsusers have commented on this narrative
18 likesusers have liked this narrative
AN


AnalystConsensusTarget on NVIDIA ·
NVDA: Expanding AI Demand Will Drive Major Data Center Investments Through 2026
Fair Value:US$232.7922.6% undervalued
928 followersusers have followed this narrative
6 commentsusers have commented on this narrative
22 likesusers have liked this narrative