
Advertisement
- Hong Kong
- /
- Renewable Energy
- /
- SEHK:182
Is Concord New Energy Group Limited (HKG:182) Undervalued After Accounting For Its Future Growth?

Concord New Energy Group Limited (HKG:182) is a stock well-positioned for future growth, but many investors are wondering whether its last closing price of HK$0.385 is based on unrealistic expectations. Below I will be talking through a basic metric which will help answer this question.
Check out our latest analysis for Concord New Energy Group
What are the future expectations?
Concord New Energy Group's extremely high growth potential in the near future is attracting investors. Expectations from 5 analysts are extremely positive with earnings per share estimated to surge from current levels of CN¥0.0588 to CN¥0.113 over the next three years. On average, this leads to a growth rate of 21% each year, which indicates an exceedlingly positive future in the near term.
Is 182's share price justifiable by its earnings growth?
Concord New Energy Group is trading at quite low price-to-earnings (PE) ratio of 5.62x. This tells us the stock is undervalued relative to the current HK market average of 12.09x , and undervalued based on its latest annual earnings update compared to the Renewable Energy average of 9.43x .
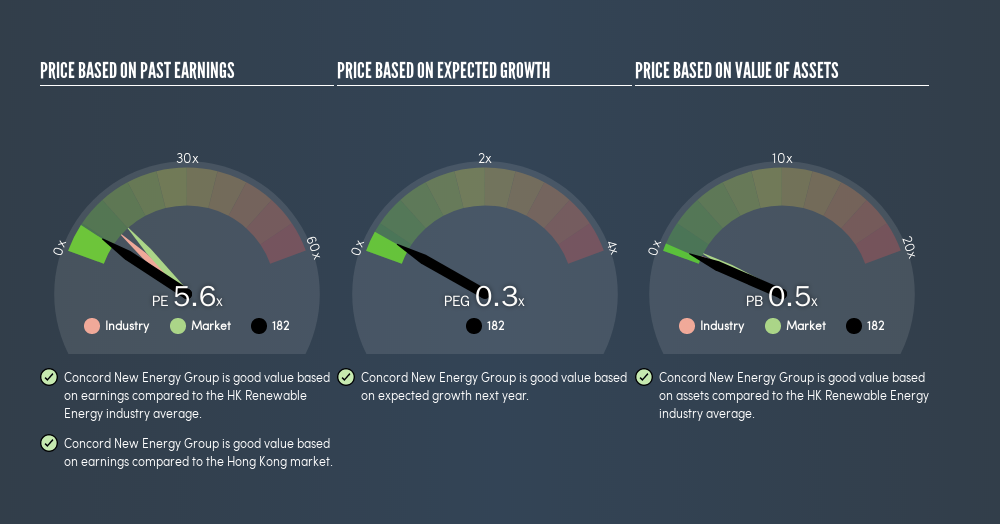
Given that 182's price-to-earnings of 5.62x lies below the industry average, this already indicates that the company could be potentially undervalued. However, seeing as Concord New Energy Group is perceived as a high-growth stock, we must also account for its earnings growth, which is captured in the PEG ratio. A PE ratio of 5.62x and expected year-on-year earnings growth of 21% give Concord New Energy Group an extremely low PEG ratio of 0.27x. So, when we include the growth factor in our analysis, Concord New Energy Group appears relatively cheap , based on its fundamentals.
What this means for you:
182's current undervaluation could signal a potential buying opportunity to increase your exposure to the stock, or it you're a potential investor, now may be the right time to buy. However, basing your investment decision off one metric alone is certainly not sufficient. There are many things I have not taken into account in this article and the PEG ratio is very one-dimensional. If you have not done so already, I highly recommend you to complete your research by taking a look at the following:
- Financial Health: Are 182’s operations financially sustainable? Balance sheets can be hard to analyze, which is why we’ve done it for you. Check out our financial health checks here.
- Past Track Record: Has 182 been consistently performing well irrespective of the ups and downs in the market? Go into more detail in the past performance analysis and take a look at the free visual representations of 182's historicals for more clarity.
- Other High-Performing Stocks: Are there other stocks that provide better prospects with proven track records? Explore our free list of these great stocks here.
We aim to bring you long-term focused research analysis driven by fundamental data. Note that our analysis may not factor in the latest price-sensitive company announcements or qualitative material.
If you spot an error that warrants correction, please contact the editor at editorial-team@simplywallst.com. This article by Simply Wall St is general in nature. It does not constitute a recommendation to buy or sell any stock, and does not take account of your objectives, or your financial situation. Simply Wall St has no position in the stocks mentioned. Thank you for reading.
About SEHK:182
Concord New Energy Group
An investment holding company, engages in the generation of power in the People’s Republic of China and internationally.
Fair value second-rate dividend payer.
Market Insights


Advertisement
Community Narratives
For the Emperor: Why Games Workshop Could Be a Star Investment
Fair Value UK£160.00|0.4% undervalued
RO
Community Contributor
Securitas will boost margins with AI and tech-driven services
Fair Value SEK 260.91|45.0% undervalued
UN
Community Contributor
A Leader in EV Charging with Growth Potential
Fair Value €27.00|20.4% undervalued
TI
Community Contributor