Advertisement
- Hong Kong
- /
- Renewable Energy
- /
- SEHK:1816
CGN Power (SEHK:1816) Margins Narrow, Undercutting Bullish Narrative on Policy-Driven Profit Stability

Simply Wall St
Reviewed by Simply Wall St
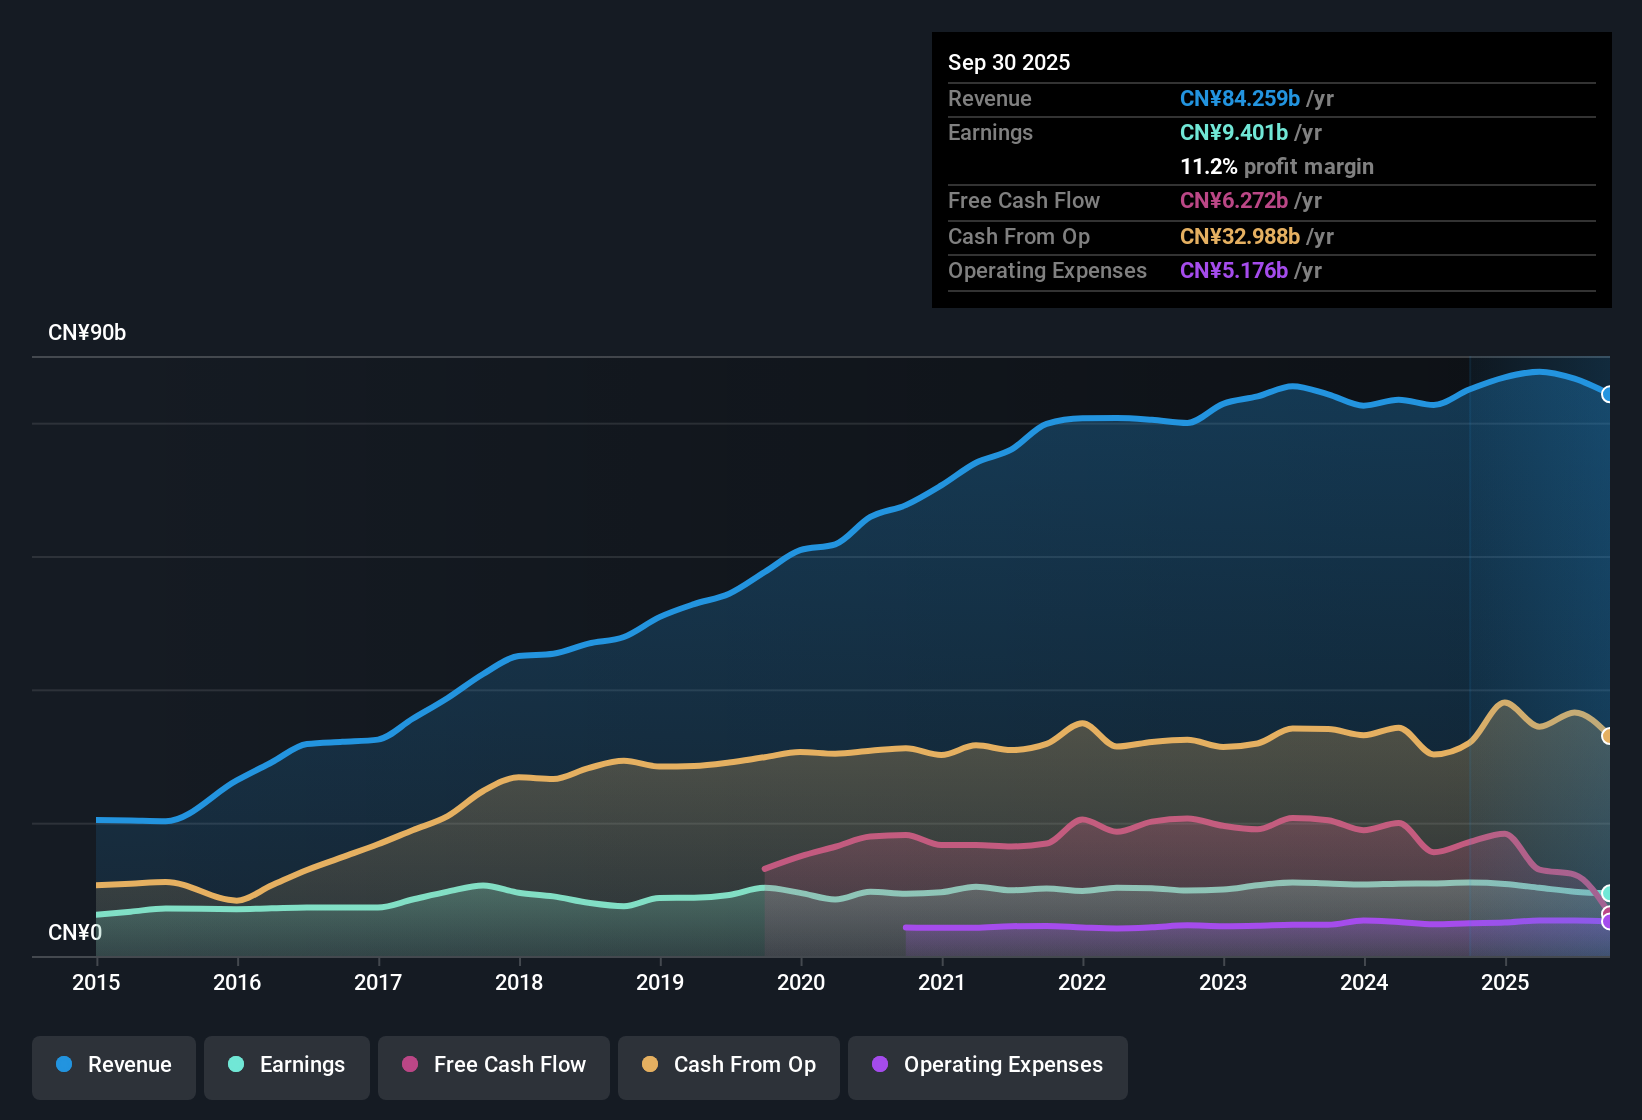
CGN Power (SEHK:1816) posted a 1.3% annual earnings growth over the past five years, while revenues are projected to climb at 6.3% per year, which lags the Hong Kong market’s expected 8.6%. Net profit margins currently sit at 11.2%, down from last year’s 13%, and forecasts see earnings growth accelerating to 8.9% per year, though this is still behind the market’s anticipated 12.3%. For investors, the numbers show mixed momentum, but a favorable Price-to-Earnings ratio and a market price below fair value add to the investment case despite ongoing financial risks.
See our full analysis for CGN Power.Next, we’ll set these results against the prevailing market narratives to see which views get reinforced and which might be challenged by the latest numbers.
Curious how numbers become stories that shape markets? Explore Community Narratives
Margins Tighten Despite High-Quality Earnings Stream
- Net profit margins contracted to 11.2%, falling from 13% the prior year, signaling some profitability squeeze even as the company’s earnings are consistently described as high quality.
- Supporters highlight that robust earnings quality helps limit downside for patient investors, but margin compression creates tension with the view that CGN Power is fully insulated from cost pressures.
- With revenue projected to grow 6.3% per year, still trailing the market benchmark, solid execution will be needed to defend these double-digit margins.
- This margin trend challenges the bullish argument that policy support alone will shield profitability if operating costs creep up over time.
Dividend and Growth Appeal Come With Financial Risk Warnings
- The company’s combination of a favorable dividend profile and ongoing profit/revenue growth is offset by explicit signals of an elevated financial risk position in the most recent summaries.
- What is notable is that while many bulls point to the attractive dividend and dependable income profile, the risk warnings about the company’s financial position mean the upside is coupled with the need for careful monitoring.
- Despite continued growth, negative earnings growth in the most recent year versus the 5-year average highlights the need for scrutiny beyond headline dividends or payout ratios.
- Investors should weigh the reward of a yield against the caution in the risk summary, rather than assuming income alone is a safety net during periods of volatile capital demands.
Valuation Ratios Offer a Margin of Safety Versus Peers
- CGN Power’s Price-to-Earnings ratio of 15.5x is more attractive than the industry average of 17.1x, and the current market price (HK$3.17) trades notably below the DCF fair value estimate of HK$5.52, both reinforcing the value angle for investors cautious about entry points.
- These metrics present a clearer case for relative value: having a P/E below regional peers and a double-digit percentage discount to fair value directly supports the argument for a margin of safety investment.
- This discount is especially relevant for those tracking sector-wide re-ratings toward "green" energy, but also points to upside potential if investor sentiment returns alongside policy momentum and margin stabilization.
- At the same time, trading at a premium to the peer average P/E (8.1x) suggests ongoing confidence in CGN Power’s quality, helping to frame the balance between value and expectations within the broader renewable sector.
Next Steps
Don't just look at this quarter; the real story is in the long-term trend. We've done an in-depth analysis on CGN Power's growth and its valuation to see if today's price is a bargain. Add the company to your watchlist or portfolio now so you don't miss the next big move.
See What Else Is Out There
Although CGN Power offers value and yield, consistent margin compression and elevated financial risk highlight its vulnerability to cost pressures and liquidity concerns.
If you’re after more resilient choices, check out solid balance sheet and fundamentals stocks screener (1980 results) where companies with stronger balance sheets and proven fiscal strength can help shield portfolios through uncertainty.
This article by Simply Wall St is general in nature. We provide commentary based on historical data and analyst forecasts only using an unbiased methodology and our articles are not intended to be financial advice. It does not constitute a recommendation to buy or sell any stock, and does not take account of your objectives, or your financial situation. We aim to bring you long-term focused analysis driven by fundamental data. Note that our analysis may not factor in the latest price-sensitive company announcements or qualitative material. Simply Wall St has no position in any stocks mentioned.
New: AI Stock Screener & Alerts
Our new AI Stock Screener scans the market every day to uncover opportunities.
• Dividend Powerhouses (3%+ Yield)
• Undervalued Small Caps with Insider Buying
• High growth Tech and AI Companies
Or build your own from over 50 metrics.
Have feedback on this article? Concerned about the content? Get in touch with us directly. Alternatively, email editorial-team@simplywallst.com
About SEHK:1816
CGN Power
Operates and manages nuclear power stations, sells electricity generated by these stations, and provides related technical services in the People’s Republic of China.
Established dividend payer and fair value.
Market Insights

Advertisement
Community Narratives
The company that turned a verb into a global necessity and basically runs the modern internet, digital ads, smartphones, maps, and AI.
Fair Value US$300.00|8.5% undervalued
OS
Community Contributor
Flowers Foods Pays A Fair Price For Health
Fair Value US$16.12|24.6% undervalued
NV
Community Contributor
TMX Group will thrive with 33.3% profit margin and enduring market moat
Fair Value CA$49.90|0.1% undervalued
LI
Community Contributor