
Advertisement
- Hong Kong
- /
- Marine and Shipping
- /
- SEHK:2343
These 4 Measures Indicate That Pacific Basin Shipping (HKG:2343) Is Using Debt Extensively
The external fund manager backed by Berkshire Hathaway's Charlie Munger, Li Lu, makes no bones about it when he says 'The biggest investment risk is not the volatility of prices, but whether you will suffer a permanent loss of capital.' So it seems the smart money knows that debt - which is usually involved in bankruptcies - is a very important factor, when you assess how risky a company is. We can see that Pacific Basin Shipping Limited (HKG:2343) does use debt in its business. But is this debt a concern to shareholders?
Why Does Debt Bring Risk?
Generally speaking, debt only becomes a real problem when a company can't easily pay it off, either by raising capital or with its own cash flow. Ultimately, if the company can't fulfill its legal obligations to repay debt, shareholders could walk away with nothing. However, a more usual (but still expensive) situation is where a company must dilute shareholders at a cheap share price simply to get debt under control. Having said that, the most common situation is where a company manages its debt reasonably well - and to its own advantage. When we think about a company's use of debt, we first look at cash and debt together.
Check out our latest analysis for Pacific Basin Shipping
What Is Pacific Basin Shipping's Net Debt?
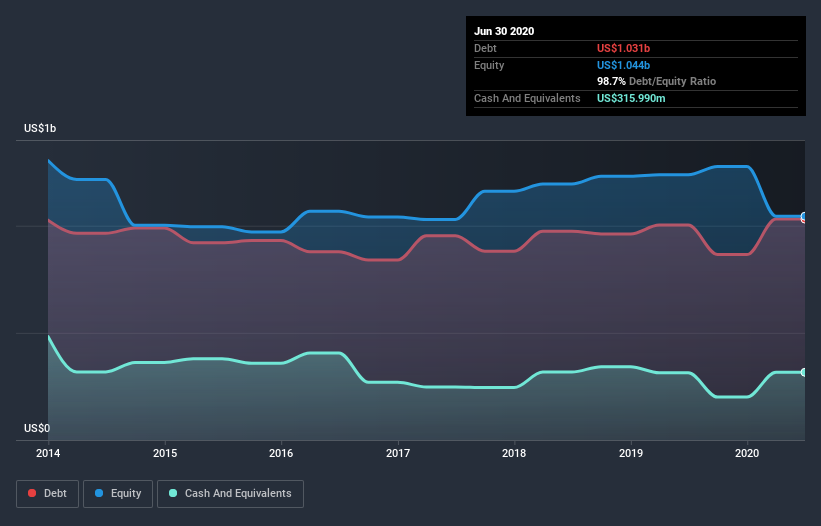
The chart below, which you can click on for greater detail, shows that Pacific Basin Shipping had US$1.03b in debt in June 2020; about the same as the year before. However, because it has a cash reserve of US$316.0m, its net debt is less, at about US$714.8m.
How Healthy Is Pacific Basin Shipping's Balance Sheet?
We can see from the most recent balance sheet that Pacific Basin Shipping had liabilities of US$345.9m falling due within a year, and liabilities of US$930.5m due beyond that. Offsetting these obligations, it had cash of US$316.0m as well as receivables valued at US$57.5m due within 12 months. So its liabilities total US$902.9m more than the combination of its cash and short-term receivables.
Given this deficit is actually higher than the company's market capitalization of US$799.4m, we think shareholders really should watch Pacific Basin Shipping's debt levels, like a parent watching their child ride a bike for the first time. Hypothetically, extremely heavy dilution would be required if the company were forced to pay down its liabilities by raising capital at the current share price.
In order to size up a company's debt relative to its earnings, we calculate its net debt divided by its earnings before interest, tax, depreciation, and amortization (EBITDA) and its earnings before interest and tax (EBIT) divided by its interest expense (its interest cover). The advantage of this approach is that we take into account both the absolute quantum of debt (with net debt to EBITDA) and the actual interest expenses associated with that debt (with its interest cover ratio).
While Pacific Basin Shipping's debt to EBITDA ratio (4.2) suggests that it uses some debt, its interest cover is very weak, at 0.96, suggesting high leverage. In large part that's due to the company's significant depreciation and amortisation charges, which arguably mean its EBITDA is a very generous measure of earnings, and its debt may be more of a burden than it first appears. It seems clear that the cost of borrowing money is negatively impacting returns for shareholders, of late. Worse, Pacific Basin Shipping's EBIT was down 48% over the last year. If earnings continue to follow that trajectory, paying off that debt load will be harder than convincing us to run a marathon in the rain. The balance sheet is clearly the area to focus on when you are analysing debt. But ultimately the future profitability of the business will decide if Pacific Basin Shipping can strengthen its balance sheet over time. So if you're focused on the future you can check out this free report showing analyst profit forecasts.
But our final consideration is also important, because a company cannot pay debt with paper profits; it needs cold hard cash. So it's worth checking how much of that EBIT is backed by free cash flow. During the last three years, Pacific Basin Shipping produced sturdy free cash flow equating to 76% of its EBIT, about what we'd expect. This cold hard cash means it can reduce its debt when it wants to.
Our View
On the face of it, Pacific Basin Shipping's interest cover left us tentative about the stock, and its EBIT growth rate was no more enticing than the one empty restaurant on the busiest night of the year. But at least it's pretty decent at converting EBIT to free cash flow; that's encouraging. Overall, it seems to us that Pacific Basin Shipping's balance sheet is really quite a risk to the business. So we're almost as wary of this stock as a hungry kitten is about falling into its owner's fish pond: once bitten, twice shy, as they say. Given our hesitation about the stock, it would be good to know if Pacific Basin Shipping insiders have sold any shares recently. You click here to find out if insiders have sold recently.
Of course, if you're the type of investor who prefers buying stocks without the burden of debt, then don't hesitate to discover our exclusive list of net cash growth stocks, today.
If you decide to trade Pacific Basin Shipping, use the lowest-cost* platform that is rated #1 Overall by Barron’s, Interactive Brokers. Trade stocks, options, futures, forex, bonds and funds on 135 markets, all from a single integrated account. Promoted
New: Manage All Your Stock Portfolios in One Place
We've created the ultimate portfolio companion for stock investors, and it's free.
• Connect an unlimited number of Portfolios and see your total in one currency
• Be alerted to new Warning Signs or Risks via email or mobile
• Track the Fair Value of your stocks
This article by Simply Wall St is general in nature. It does not constitute a recommendation to buy or sell any stock, and does not take account of your objectives, or your financial situation. We aim to bring you long-term focused analysis driven by fundamental data. Note that our analysis may not factor in the latest price-sensitive company announcements or qualitative material. Simply Wall St has no position in any stocks mentioned.
*Interactive Brokers Rated Lowest Cost Broker by StockBrokers.com Annual Online Review 2020
Have feedback on this article? Concerned about the content? Get in touch with us directly. Alternatively, email editorial-team@simplywallst.com.
About SEHK:2343
Pacific Basin Shipping
An investment holding company, engages in the provision of dry bulk shipping services in Hong Kong and internationally.
Flawless balance sheet with proven track record and pays a dividend.
Similar Companies
Market Insights

Advertisement
Community Narratives
Groundbreaking therapies that could change the treatment landscape for PTSD, fibromyalgia, MS & Alzheimer’s
Fair Value US$6.20|86.9% undervalued
CM
Community Contributor
DigitalOcean Will Grow 14% by Embracing AI with Paperspace Acquisition
Fair Value US$50.00|41.7% undervalued
NE
Community Contributor
Viant Technology: A Rising AdTech Challenger in the AI-Powered CTV Market
Fair Value US$38.61|63.2% undervalued
BL
Community Contributor
Volvo will Accelerate Forward into Electric and Autonomous Leadership in Five Years
Fair Value SEK 438.80|39.7% undervalued
UN
Community Contributor