Advertisement
- Hong Kong
- /
- Tech Hardware
- /
- SEHK:992
Are Lenovo Shares Attractive After Recent AI Expansion and This Month’s 13% Pullback?

Simply Wall St
Reviewed by Bailey Pemberton
- Curious if Lenovo Group is trading at a bargain or if it's time to cash in? You are not alone. Many investors are questioning Lenovo's true value right now.
- The stock has seen plenty of action recently, dipping by 10.9% over the last week and down 13.4% over the past month. It is still up an impressive 11.3% for the year and a significant 110.0% over five years.
- Recent headlines have highlighted Lenovo's global expansion plans and new partnerships in the AI and cloud computing spaces. These developments have stirred investor excitement and may have contributed to the stock's long-term outperformance. However, heightened volatility around technology stocks this month may explain some of the latest pullback as sentiment shifts across the sector.
- Looking at the numbers, Lenovo Group picks up a 5/6 valuation score, suggesting it is priced attractively on most metrics reviewed. Upcoming sections will explore the major valuation methods typically used for Lenovo. Additionally, a new approach to assessing value will be introduced that could change how you view this stock.
Find out why Lenovo Group's 11.3% return over the last year is lagging behind its peers.
Approach 1: Lenovo Group Discounted Cash Flow (DCF) Analysis
The Discounted Cash Flow (DCF) model is a method that estimates a company's intrinsic value by projecting its future cash flows and then discounting them back to today's value. This gives investors an idea of what the business is worth, based on realistic expectations for future performance.
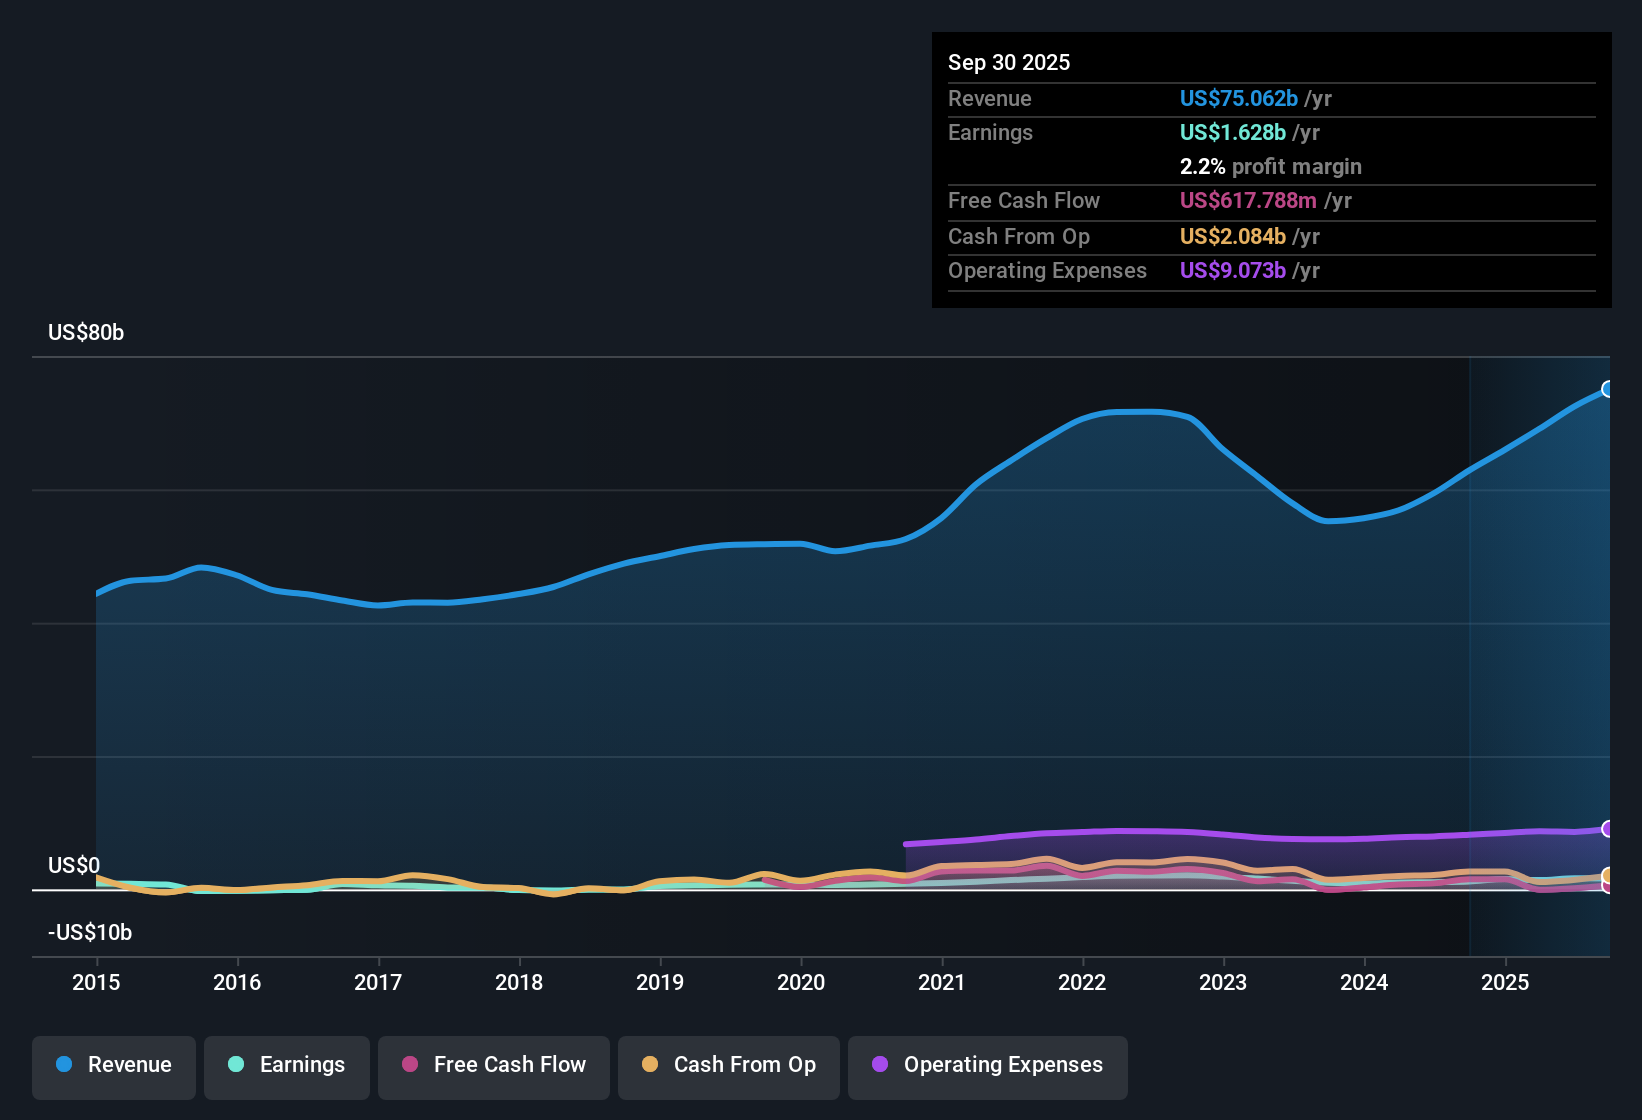
For Lenovo Group, the current Free Cash Flow sits at a negative $361.8 Million, reflecting recent operational or investment costs. Looking forward, analyst projections show significant improvements. The company is expected to generate $2.3 Billion in Free Cash Flow by 2028, with Simply Wall St extrapolating even further growth over the next decade. Ten-year forecasts suggest Free Cash Flow could gradually rise, with most future years exceeding $2 Billion.
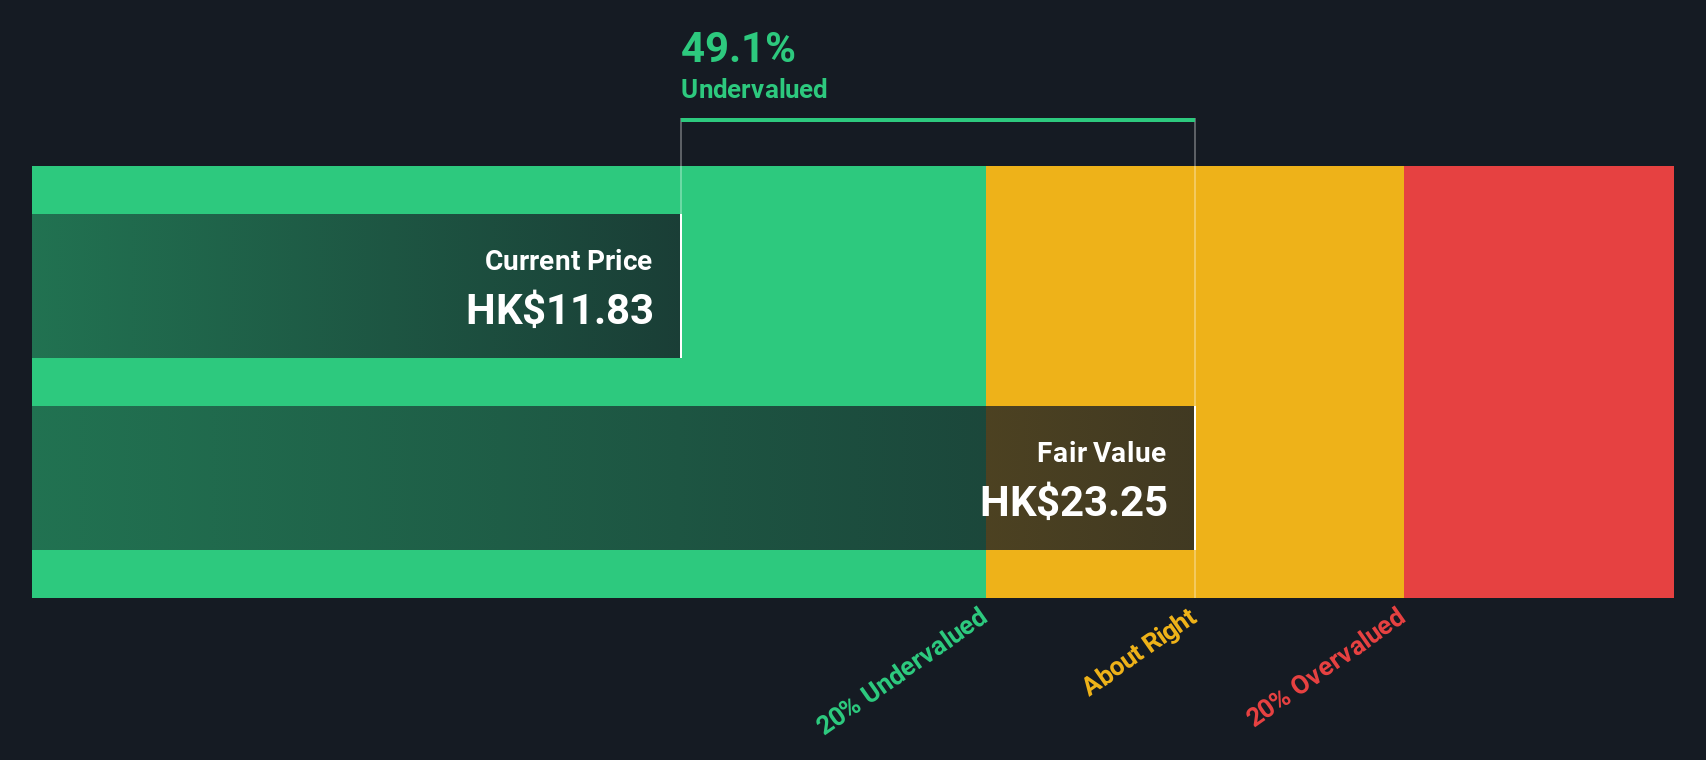
According to this DCF model, Lenovo Group’s estimated fair value is $19.06 per share. The DCF indicates shares are trading at a 49.3% discount to this intrinsic value, so the stock currently appears substantially undervalued by almost half.
Result: UNDERVALUED
Our Discounted Cash Flow (DCF) analysis suggests Lenovo Group is undervalued by 49.3%. Track this in your watchlist or portfolio, or discover 894 more undervalued stocks based on cash flows.
Approach 2: Lenovo Group Price vs Earnings (P/E)
For established and consistently profitable companies like Lenovo Group, the price-to-earnings (P/E) multiple is a popular and practical valuation yardstick. This metric essentially indicates what investors are willing to pay today for each dollar of the company's earnings, providing a quick reference for relative value.
The "normal" or "fair" P/E ratio for a stock is influenced by expected future growth, risk factors, and the overall market environment. Companies expected to grow quickly and deliver stable earnings typically command higher P/E ratios, while higher risks or lower growth prospects justify lower multiples.
Currently, Lenovo's P/E sits at 9.36x. This is well below the Tech industry average of 21.96x and significantly under the peer group average of 31.28x. At a glance, Lenovo's shares appear attractively valued compared to major benchmarks. However, simply comparing to industry or peer averages only accounts for broad trends and can overlook factors specific to Lenovo's business.
That is where Simply Wall St's "Fair Ratio" comes in. The Fair Ratio for Lenovo stands at 16.90x, a level that considers the company's projected earnings growth, profit margins, business risks, market cap, and other factors unique to Lenovo. This provides a more tailored and reliable comparison than peers or industry averages alone.
With Lenovo's current P/E multiple of 9.36x versus a Fair Ratio of 16.90x, the stock appears clearly undervalued when considering the complete picture.
Result: UNDERVALUED

PE ratios tell one story, but what if the real opportunity lies elsewhere? Discover 1417 companies where insiders are betting big on explosive growth.
Upgrade Your Decision Making: Choose your Lenovo Group Narrative
Earlier we mentioned that there is an even better way to understand valuation, so let's introduce you to Narratives. A Narrative is your story about a company: the set of assumptions and beliefs you have about Lenovo Group's future, including your estimates for revenue growth, profit margins, and what you think a fair price should be.
With Narratives, you can link Lenovo's story to a financial forecast and use that to estimate a personalized fair value. This approach goes beyond simple ratios, letting you test your investment ideas and see how the numbers change as your view of the company's prospects evolve.
On Simply Wall St's Community page, Narratives are an easy and accessible tool. You can build your own, follow those created by millions of investors, and quickly see how other perspectives align with your own.
Narratives make buy or sell decisions clearer by showing how your fair value estimate compares directly with Lenovo's current market price. Because they update automatically when news or earnings are announced, you always have the latest information at your fingertips.
For example, some investors believe Lenovo’s earnings could surge to $2.6 billion and are comfortable paying up to HK$16.07 per share, while more cautious views put fair value at just HK$11.0. Your Narrative helps you decide what makes sense for you.
Do you think there's more to the story for Lenovo Group? Head over to our Community to see what others are saying!
This article by Simply Wall St is general in nature. We provide commentary based on historical data and analyst forecasts only using an unbiased methodology and our articles are not intended to be financial advice. It does not constitute a recommendation to buy or sell any stock, and does not take account of your objectives, or your financial situation. We aim to bring you long-term focused analysis driven by fundamental data. Note that our analysis may not factor in the latest price-sensitive company announcements or qualitative material. Simply Wall St has no position in any stocks mentioned.
New: AI Stock Screener & Alerts
Our new AI Stock Screener scans the market every day to uncover opportunities.
• Dividend Powerhouses (3%+ Yield)
• Undervalued Small Caps with Insider Buying
• High growth Tech and AI Companies
Or build your own from over 50 metrics.
Have feedback on this article? Concerned about the content? Get in touch with us directly. Alternatively, email editorial-team@simplywallst.com
About SEHK:992
Lenovo Group
An investment holding company, develops, manufactures, and markets technology products and services.
Outstanding track record, undervalued and pays a dividend.
Similar Companies
Market Insights

Advertisement
Community Narratives
MicroVision will explode future revenue by 380.37% with a vision towards success
Fair Value US$60.00|98.5% undervalued
TH
Community Contributor
The Indispensable Artery for a New North American Economy
Fair Value CA$132.87|2.3% undervalued
TI
Community Contributor