
Advertisement
IRICO Group New Energy Company Limited's (HKG:438) 26% Price Boost Is Out Of Tune With Revenues
Despite an already strong run, IRICO Group New Energy Company Limited (HKG:438) shares have been powering on, with a gain of 26% in the last thirty days. Still, the 30-day jump doesn't change the fact that longer term shareholders have seen their stock decimated by the 57% share price drop in the last twelve months.
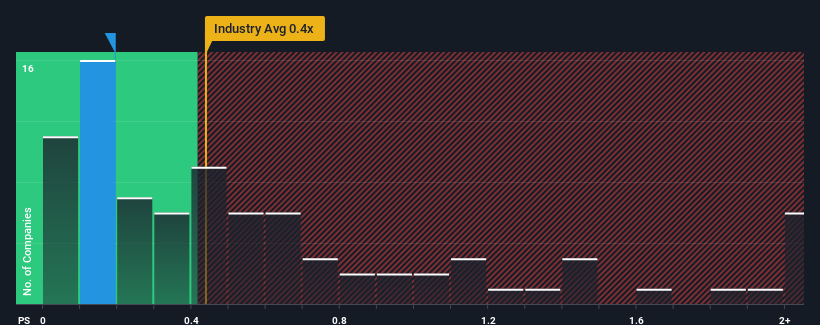
Although its price has surged higher, you could still be forgiven for feeling indifferent about IRICO Group New Energy's P/S ratio of 0.2x, since the median price-to-sales (or "P/S") ratio for the Electronic industry in Hong Kong is also close to 0.4x. While this might not raise any eyebrows, if the P/S ratio is not justified investors could be missing out on a potential opportunity or ignoring looming disappointment.
View our latest analysis for IRICO Group New Energy
What Does IRICO Group New Energy's Recent Performance Look Like?
Revenue has risen firmly for IRICO Group New Energy recently, which is pleasing to see. It might be that many expect the respectable revenue performance to wane, which has kept the P/S from rising. If that doesn't eventuate, then existing shareholders probably aren't too pessimistic about the future direction of the share price.
Want the full picture on earnings, revenue and cash flow for the company? Then our free report on IRICO Group New Energy will help you shine a light on its historical performance.Do Revenue Forecasts Match The P/S Ratio?
The only time you'd be comfortable seeing a P/S like IRICO Group New Energy's is when the company's growth is tracking the industry closely.
Retrospectively, the last year delivered an exceptional 27% gain to the company's top line. The latest three year period has also seen a 25% overall rise in revenue, aided extensively by its short-term performance. So we can start by confirming that the company has actually done a good job of growing revenue over that time.
This is in contrast to the rest of the industry, which is expected to grow by 19% over the next year, materially higher than the company's recent medium-term annualised growth rates.
With this in mind, we find it intriguing that IRICO Group New Energy's P/S is comparable to that of its industry peers. It seems most investors are ignoring the fairly limited recent growth rates and are willing to pay up for exposure to the stock. They may be setting themselves up for future disappointment if the P/S falls to levels more in line with recent growth rates.
The Key Takeaway
IRICO Group New Energy's stock has a lot of momentum behind it lately, which has brought its P/S level with the rest of the industry. It's argued the price-to-sales ratio is an inferior measure of value within certain industries, but it can be a powerful business sentiment indicator.
We've established that IRICO Group New Energy's average P/S is a bit surprising since its recent three-year growth is lower than the wider industry forecast. Right now we are uncomfortable with the P/S as this revenue performance isn't likely to support a more positive sentiment for long. Unless there is a significant improvement in the company's medium-term performance, it will be difficult to prevent the P/S ratio from declining to a more reasonable level.
Before you take the next step, you should know about the 2 warning signs for IRICO Group New Energy (1 is a bit unpleasant!) that we have uncovered.
Of course, profitable companies with a history of great earnings growth are generally safer bets. So you may wish to see this free collection of other companies that have reasonable P/E ratios and have grown earnings strongly.
New: AI Stock Screener & Alerts
Our new AI Stock Screener scans the market every day to uncover opportunities.
• Dividend Powerhouses (3%+ Yield)
• Undervalued Small Caps with Insider Buying
• High growth Tech and AI Companies
Or build your own from over 50 metrics.
Have feedback on this article? Concerned about the content? Get in touch with us directly. Alternatively, email editorial-team (at) simplywallst.com.
This article by Simply Wall St is general in nature. We provide commentary based on historical data and analyst forecasts only using an unbiased methodology and our articles are not intended to be financial advice. It does not constitute a recommendation to buy or sell any stock, and does not take account of your objectives, or your financial situation. We aim to bring you long-term focused analysis driven by fundamental data. Note that our analysis may not factor in the latest price-sensitive company announcements or qualitative material. Simply Wall St has no position in any stocks mentioned.
About SEHK:438
IRICO Group New Energy
Engages in the research and development, manufacturing, and sale of solar photovoltaic glass in the People’s Republic of China and internationally.
Low risk and slightly overvalued.
Market Insights


Advertisement
Community Narratives
The Next Phase of Energy Storage: How NeoVolta Is Tackling America’s Power Crunch
Fair Value US$7.50|39.3% undervalued
MA
Community Contributor
Why EnSilica is Worth Possibly 13x its Current Price
Fair Value UK£5.00|91.8% undervalued
DO
Community Contributor
A case for Cassiar Gold Corp (TSXV: GLDC) to reach CAD$8-10 before 2030 (X30-37)
Fair Value CA$10.00|97.4% undervalued
AG
Community Contributor
M&A Activity, Industry Diversification & A Defense Contract Monopoly Will Push BWXT For Healthy Long-Term Growth
Fair Value US$220.00|17.3% undervalued
CL
Community Contributor