- Hong Kong
- /
- Tech Hardware
- /
- SEHK:334
Here's What's Concerning About China Display Optoelectronics Technology Holdings' (HKG:334) Returns On Capital

If we want to find a potential multi-bagger, often there are underlying trends that can provide clues. Firstly, we'll want to see a proven return on capital employed (ROCE) that is increasing, and secondly, an expanding base of capital employed. Put simply, these types of businesses are compounding machines, meaning they are continually reinvesting their earnings at ever-higher rates of return. Having said that, from a first glance at China Display Optoelectronics Technology Holdings (HKG:334) we aren't jumping out of our chairs at how returns are trending, but let's have a deeper look.
Understanding Return On Capital Employed (ROCE)
For those that aren't sure what ROCE is, it measures the amount of pre-tax profits a company can generate from the capital employed in its business. To calculate this metric for China Display Optoelectronics Technology Holdings, this is the formula:
Return on Capital Employed = Earnings Before Interest and Tax (EBIT) ÷ (Total Assets - Current Liabilities)
0.19 = CN¥194m ÷ (CN¥2.7b - CN¥1.7b) (Based on the trailing twelve months to June 2022).
Thus, China Display Optoelectronics Technology Holdings has an ROCE of 19%. In absolute terms, that's a satisfactory return, but compared to the Tech industry average of 5.3% it's much better.
View our latest analysis for China Display Optoelectronics Technology Holdings
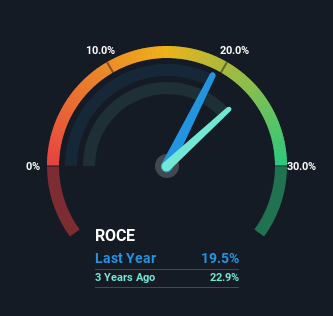
Historical performance is a great place to start when researching a stock so above you can see the gauge for China Display Optoelectronics Technology Holdings' ROCE against it's prior returns. If you want to delve into the historical earnings, revenue and cash flow of China Display Optoelectronics Technology Holdings, check out these free graphs here.
What Can We Tell From China Display Optoelectronics Technology Holdings' ROCE Trend?
When we looked at the ROCE trend at China Display Optoelectronics Technology Holdings, we didn't gain much confidence. Around five years ago the returns on capital were 37%, but since then they've fallen to 19%. Although, given both revenue and the amount of assets employed in the business have increased, it could suggest the company is investing in growth, and the extra capital has led to a short-term reduction in ROCE. And if the increased capital generates additional returns, the business, and thus shareholders, will benefit in the long run.
On a separate but related note, it's important to know that China Display Optoelectronics Technology Holdings has a current liabilities to total assets ratio of 63%, which we'd consider pretty high. This effectively means that suppliers (or short-term creditors) are funding a large portion of the business, so just be aware that this can introduce some elements of risk. While it's not necessarily a bad thing, it can be beneficial if this ratio is lower.
In Conclusion...
Even though returns on capital have fallen in the short term, we find it promising that revenue and capital employed have both increased for China Display Optoelectronics Technology Holdings. These growth trends haven't led to growth returns though, since the stock has fallen 62% over the last five years. As a result, we'd recommend researching this stock further to uncover what other fundamentals of the business can show us.
On a separate note, we've found 1 warning sign for China Display Optoelectronics Technology Holdings you'll probably want to know about.
If you want to search for solid companies with great earnings, check out this free list of companies with good balance sheets and impressive returns on equity.
The New Payments ETF Is Live on NASDAQ:
Money is moving to real-time rails, and a newly listed ETF now gives investors direct exposure. Fast settlement. Institutional custody. Simple access.
Explore how this launch could reshape portfolios
Sponsored ContentNew: AI Stock Screener & Alerts
Our new AI Stock Screener scans the market every day to uncover opportunities.
• Dividend Powerhouses (3%+ Yield)
• Undervalued Small Caps with Insider Buying
• High growth Tech and AI Companies
Or build your own from over 50 metrics.
Have feedback on this article? Concerned about the content? Get in touch with us directly. Alternatively, email editorial-team (at) simplywallst.com.
This article by Simply Wall St is general in nature. We provide commentary based on historical data and analyst forecasts only using an unbiased methodology and our articles are not intended to be financial advice. It does not constitute a recommendation to buy or sell any stock, and does not take account of your objectives, or your financial situation. We aim to bring you long-term focused analysis driven by fundamental data. Note that our analysis may not factor in the latest price-sensitive company announcements or qualitative material. Simply Wall St has no position in any stocks mentioned.
About SEHK:334
China Display Optoelectronics Technology Holdings
An investment holding company, engages in the research, development, manufacture, distribution, and sale of liquid crystal display modules for mobile phones and tablets.
Flawless balance sheet with acceptable track record.
Market Insights

Weekly Picks

Early mover in a fast growing industry. Likely to experience share price volatility as they scale


A case for CA$31.80 (undiluted), aka 8,616% upside from CA$0.37 (an 86 bagger!).


Moderation and Stabilisation: HOLD: Fair Price based on a 4-year Cycle is $12.08
Recently Updated Narratives


Title: Market Sentiment Is Dead Wrong — Here's Why PSEC Deserves a Second Look


An amazing opportunity to potentially get a 100 bagger

Amazon: Why the World’s Biggest Platform Still Runs on Invisible Economics
Popular Narratives


Crazy Undervalued 42 Baggers Silver Play (Active & Running Mine)


MicroVision will explode future revenue by 380.37% with a vision towards success


NVDA: Expanding AI Demand Will Drive Major Data Center Investments Through 2026
Trending Discussion
