Risks Still Elevated At These Prices As Tianli Holdings Group Limited (HKG:117) Shares Dive 27%

Tianli Holdings Group Limited (HKG:117) shares have retraced a considerable 27% in the last month, reversing a fair amount of their solid recent performance. Instead of being rewarded, shareholders who have already held through the last twelve months are now sitting on a 19% share price drop.
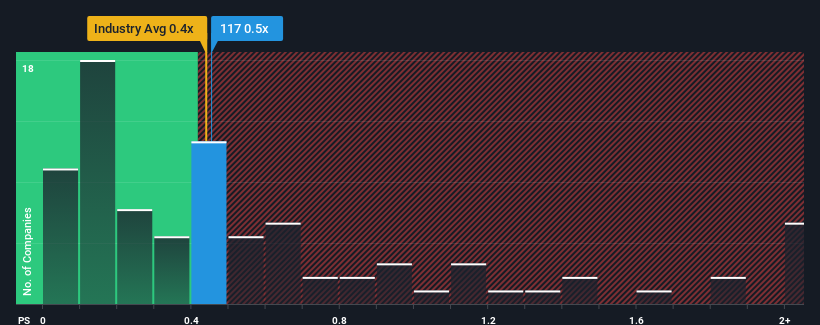
Even after such a large drop in price, there still wouldn't be many who think Tianli Holdings Group's price-to-sales (or "P/S") ratio of 0.5x is worth a mention when the median P/S in Hong Kong's Electronic industry is similar at about 0.4x. However, investors might be overlooking a clear opportunity or potential setback if there is no rational basis for the P/S.
View our latest analysis for Tianli Holdings Group
How Has Tianli Holdings Group Performed Recently?
With revenue growth that's exceedingly strong of late, Tianli Holdings Group has been doing very well. The P/S is probably moderate because investors think this strong revenue growth might not be enough to outperform the broader industry in the near future. Those who are bullish on Tianli Holdings Group will be hoping that this isn't the case, so that they can pick up the stock at a lower valuation.
Want the full picture on earnings, revenue and cash flow for the company? Then our free report on Tianli Holdings Group will help you shine a light on its historical performance.Do Revenue Forecasts Match The P/S Ratio?
There's an inherent assumption that a company should be matching the industry for P/S ratios like Tianli Holdings Group's to be considered reasonable.
Retrospectively, the last year delivered an exceptional 35% gain to the company's top line. As a result, it also grew revenue by 11% in total over the last three years. Therefore, it's fair to say the revenue growth recently has been respectable for the company.
Comparing the recent medium-term revenue trends against the industry's one-year growth forecast of 20% shows it's noticeably less attractive.
With this information, we find it interesting that Tianli Holdings Group is trading at a fairly similar P/S compared to the industry. It seems most investors are ignoring the fairly limited recent growth rates and are willing to pay up for exposure to the stock. Maintaining these prices will be difficult to achieve as a continuation of recent revenue trends is likely to weigh down the shares eventually.
What Does Tianli Holdings Group's P/S Mean For Investors?
Tianli Holdings Group's plummeting stock price has brought its P/S back to a similar region as the rest of the industry. Using the price-to-sales ratio alone to determine if you should sell your stock isn't sensible, however it can be a practical guide to the company's future prospects.
Our examination of Tianli Holdings Group revealed its poor three-year revenue trends aren't resulting in a lower P/S as per our expectations, given they look worse than current industry outlook. Right now we are uncomfortable with the P/S as this revenue performance isn't likely to support a more positive sentiment for long. If recent medium-term revenue trends continue, the probability of a share price decline will become quite substantial, placing shareholders at risk.
And what about other risks? Every company has them, and we've spotted 3 warning signs for Tianli Holdings Group (of which 1 is potentially serious!) you should know about.
If these risks are making you reconsider your opinion on Tianli Holdings Group, explore our interactive list of high quality stocks to get an idea of what else is out there.
The New Payments ETF Is Live on NASDAQ:
Money is moving to real-time rails, and a newly listed ETF now gives investors direct exposure. Fast settlement. Institutional custody. Simple access.
Explore how this launch could reshape portfolios
Sponsored ContentValuation is complex, but we're here to simplify it.
Discover if Tianli Holdings Group might be undervalued or overvalued with our detailed analysis, featuring fair value estimates, potential risks, dividends, insider trades, and its financial condition.
Access Free AnalysisHave feedback on this article? Concerned about the content? Get in touch with us directly. Alternatively, email editorial-team (at) simplywallst.com.
This article by Simply Wall St is general in nature. We provide commentary based on historical data and analyst forecasts only using an unbiased methodology and our articles are not intended to be financial advice. It does not constitute a recommendation to buy or sell any stock, and does not take account of your objectives, or your financial situation. We aim to bring you long-term focused analysis driven by fundamental data. Note that our analysis may not factor in the latest price-sensitive company announcements or qualitative material. Simply Wall St has no position in any stocks mentioned.
About SEHK:117
Tianli Holdings Group
An investment holding company, manufactures and sells multi-layer ceramic capacitors (MLCC) in Mainland China, Hong Kong, and internationally.
Slight risk and overvalued.
Market Insights

Weekly Picks

Early mover in a fast growing industry. Likely to experience share price volatility as they scale


A case for CA$31.80 (undiluted), aka 8,616% upside from CA$0.37 (an 86 bagger!).


Moderation and Stabilisation: HOLD: Fair Price based on a 4-year Cycle is $12.08
Recently Updated Narratives


Title: Market Sentiment Is Dead Wrong — Here's Why PSEC Deserves a Second Look


An amazing opportunity to potentially get a 100 bagger

Amazon: Why the World’s Biggest Platform Still Runs on Invisible Economics
Popular Narratives


MicroVision will explode future revenue by 380.37% with a vision towards success


Crazy Undervalued 42 Baggers Silver Play (Active & Running Mine)


NVDA: Expanding AI Demand Will Drive Major Data Center Investments Through 2026
Trending Discussion
