
Advertisement
A Piece Of The Puzzle Missing From Vision Values Holdings Limited's (HKG:862) 43% Share Price Climb
Vision Values Holdings Limited (HKG:862) shareholders would be excited to see that the share price has had a great month, posting a 43% gain and recovering from prior weakness. But the last month did very little to improve the 59% share price decline over the last year.
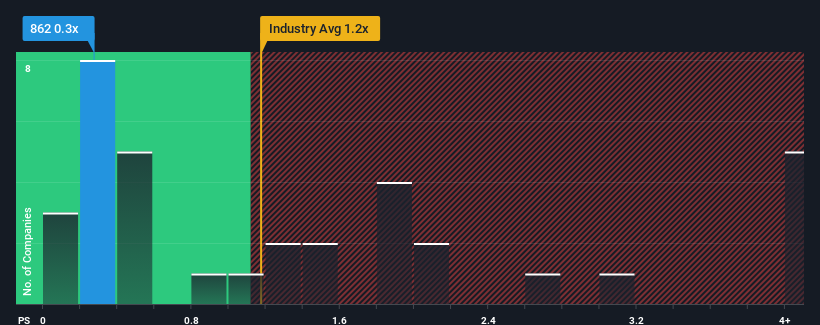
In spite of the firm bounce in price, given about half the companies operating in Hong Kong's IT industry have price-to-sales ratios (or "P/S") above 1.2x, you may still consider Vision Values Holdings as an attractive investment with its 0.3x P/S ratio. Although, it's not wise to just take the P/S at face value as there may be an explanation why it's limited.
Check out our latest analysis for Vision Values Holdings
What Does Vision Values Holdings' Recent Performance Look Like?
With revenue growth that's exceedingly strong of late, Vision Values Holdings has been doing very well. One possibility is that the P/S ratio is low because investors think this strong revenue growth might actually underperform the broader industry in the near future. Those who are bullish on Vision Values Holdings will be hoping that this isn't the case, so that they can pick up the stock at a lower valuation.
We don't have analyst forecasts, but you can see how recent trends are setting up the company for the future by checking out our free report on Vision Values Holdings' earnings, revenue and cash flow.Is There Any Revenue Growth Forecasted For Vision Values Holdings?
In order to justify its P/S ratio, Vision Values Holdings would need to produce sluggish growth that's trailing the industry.
Retrospectively, the last year delivered an exceptional 74% gain to the company's top line. Spectacularly, three year revenue growth has ballooned by several orders of magnitude, thanks in part to the last 12 months of revenue growth. Therefore, it's fair to say the revenue growth recently has been superb for the company.
When compared to the industry's one-year growth forecast of 14%, the most recent medium-term revenue trajectory is noticeably more alluring
With this in mind, we find it intriguing that Vision Values Holdings' P/S isn't as high compared to that of its industry peers. Apparently some shareholders believe the recent performance has exceeded its limits and have been accepting significantly lower selling prices.
What Does Vision Values Holdings' P/S Mean For Investors?
Vision Values Holdings' stock price has surged recently, but its but its P/S still remains modest. Generally, our preference is to limit the use of the price-to-sales ratio to establishing what the market thinks about the overall health of a company.
We're very surprised to see Vision Values Holdings currently trading on a much lower than expected P/S since its recent three-year growth is higher than the wider industry forecast. Potential investors that are sceptical over continued revenue performance may be preventing the P/S ratio from matching previous strong performance. While recent revenue trends over the past medium-term suggest that the risk of a price decline is low, investors appear to perceive a likelihood of revenue fluctuations in the future.
It's always necessary to consider the ever-present spectre of investment risk. We've identified 3 warning signs with Vision Values Holdings (at least 2 which are a bit unpleasant), and understanding them should be part of your investment process.
Of course, profitable companies with a history of great earnings growth are generally safer bets. So you may wish to see this free collection of other companies that have reasonable P/E ratios and have grown earnings strongly.
New: Manage All Your Stock Portfolios in One Place
We've created the ultimate portfolio companion for stock investors, and it's free.
• Connect an unlimited number of Portfolios and see your total in one currency
• Be alerted to new Warning Signs or Risks via email or mobile
• Track the Fair Value of your stocks
Have feedback on this article? Concerned about the content? Get in touch with us directly. Alternatively, email editorial-team (at) simplywallst.com.
This article by Simply Wall St is general in nature. We provide commentary based on historical data and analyst forecasts only using an unbiased methodology and our articles are not intended to be financial advice. It does not constitute a recommendation to buy or sell any stock, and does not take account of your objectives, or your financial situation. We aim to bring you long-term focused analysis driven by fundamental data. Note that our analysis may not factor in the latest price-sensitive company announcements or qualitative material. Simply Wall St has no position in any stocks mentioned.
About SEHK:862
Vision Values Holdings
An investment holding company, engages in the provision of network solutions and project services in Hong Kong, Mainland China, and Mongolia.
Adequate balance sheet and overvalued.
Market Insights

Advertisement
Weekly Picks
RO


RockeTeller on Santacruz Silver Mining ·
Crazy Undervalued 42 Baggers Silver Play (Active & Running Mine)
Fair Value:CA$8696.7% undervalued
47 followersusers have followed this narrative
6 commentsusers have commented on this narrative
15 likesusers have liked this narrative
RO


Robbo on Fiducian Group ·
Fiducian: Compliance Clouds or Value Opportunity?
Fair Value:AU$123.8% undervalued
7 followersusers have followed this narrative
0 commentsusers have commented on this narrative
0 likesusers have liked this narrative
WO

woodworthfund on Willamette Valley Vineyards ·
Willamette Valley Vineyards (WVVI): Not-So-Great Value
Fair Value:US$247.5% overvalued
9 followersusers have followed this narrative
0 commentsusers have commented on this narrative
1 likeusers have liked this narrative
Recently Updated Narratives
IN

IncomeAssets on Pulse Seismic ·
Watch Pulse Seismic Outperform with 13.6% Revenue Growth in the Coming Years
Fair Value:CA$4.4729.5% undervalued
2 followersusers have followed this narrative
0 commentsusers have commented on this narrative
0 likesusers have liked this narrative
VL

Vladislav on Galleon Gold ·
Significantly undervalued gold explorer in Timmins, finally getting traction
Fair Value:CA$482.8% undervalued
4 followersusers have followed this narrative
0 commentsusers have commented on this narrative
0 likesusers have liked this narrative
FU

FundamentallySarcastic on Credit Corp Group ·
Moderation and Stabilisation: HOLD: Fair Price based on a 4-year Cycle is $12.08
Fair Value:AU$12.6411.8% overvalued
5 followersusers have followed this narrative
0 commentsusers have commented on this narrative
0 likesusers have liked this narrative
Popular Narratives
TH


TheWallstreetKing on MicroVision ·
MicroVision will explode future revenue by 380.37% with a vision towards success
Fair Value:US$6098.5% undervalued
116 followersusers have followed this narrative
11 commentsusers have commented on this narrative
22 likesusers have liked this narrative
AN


AnalystConsensusTarget on NVIDIA ·
NVDA: Expanding AI Demand Will Drive Major Data Center Investments Through 2026
Fair Value:US$250.3926.8% undervalued
957 followersusers have followed this narrative
6 commentsusers have commented on this narrative
25 likesusers have liked this narrative
AN

AnalystConsensusTarget on Alphabet ·
GOOGL: AI Platform Expansion And Cloud Demand Will Support Durable Performance Amid Competitive Pressures
Fair Value:US$323.71.9% undervalued
1342 followersusers have followed this narrative
0 commentsusers have commented on this narrative
17 likesusers have liked this narrative

