- Hong Kong
- /
- Semiconductors
- /
- SEHK:968
The three-year shareholder returns and company earnings persist lower as Xinyi Solar Holdings (HKG:968) stock falls a further 9.1% in past week


Every investor on earth makes bad calls sometimes. But you have a problem if you face massive losses more than once in a while. So take a moment to sympathize with the long term shareholders of Xinyi Solar Holdings Limited (HKG:968), who have seen the share price tank a massive 77% over a three year period. That would be a disturbing experience. The more recent news is of little comfort, with the share price down 55% in a year. Shareholders have had an even rougher run lately, with the share price down 33% in the last 90 days.
Since Xinyi Solar Holdings has shed HK$3.6b from its value in the past 7 days, let's see if the longer term decline has been driven by the business' economics.
Check out our latest analysis for Xinyi Solar Holdings
In his essay The Superinvestors of Graham-and-Doddsville Warren Buffett described how share prices do not always rationally reflect the value of a business. One flawed but reasonable way to assess how sentiment around a company has changed is to compare the earnings per share (EPS) with the share price.
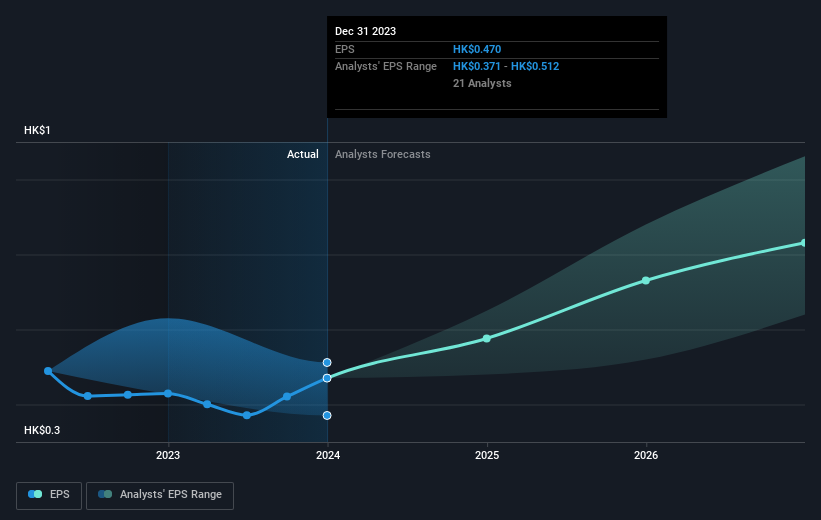
Xinyi Solar Holdings saw its EPS decline at a compound rate of 5.3% per year, over the last three years. The share price decline of 39% is actually steeper than the EPS slippage. So it's likely that the EPS decline has disappointed the market, leaving investors hesitant to buy. This increased caution is also evident in the rather low P/E ratio, which is sitting at 8.51.
You can see below how EPS has changed over time (discover the exact values by clicking on the image).
We consider it positive that insiders have made significant purchases in the last year. Having said that, most people consider earnings and revenue growth trends to be a more meaningful guide to the business. Before buying or selling a stock, we always recommend a close examination of historic growth trends, available here..
A Different Perspective
Xinyi Solar Holdings shareholders are down 53% for the year (even including dividends), but the market itself is up 7.3%. However, keep in mind that even the best stocks will sometimes underperform the market over a twelve month period. On the bright side, long term shareholders have made money, with a gain of 4% per year over half a decade. It could be that the recent sell-off is an opportunity, so it may be worth checking the fundamental data for signs of a long term growth trend. While it is well worth considering the different impacts that market conditions can have on the share price, there are other factors that are even more important. For instance, we've identified 1 warning sign for Xinyi Solar Holdings that you should be aware of.
There are plenty of other companies that have insiders buying up shares. You probably do not want to miss this free list of undervalued small cap companies that insiders are buying.
Please note, the market returns quoted in this article reflect the market weighted average returns of stocks that currently trade on Hong Kong exchanges.
New: AI Stock Screener & Alerts
Our new AI Stock Screener scans the market every day to uncover opportunities.
• Dividend Powerhouses (3%+ Yield)
• Undervalued Small Caps with Insider Buying
• High growth Tech and AI Companies
Or build your own from over 50 metrics.
Have feedback on this article? Concerned about the content? Get in touch with us directly. Alternatively, email editorial-team (at) simplywallst.com.
This article by Simply Wall St is general in nature. We provide commentary based on historical data and analyst forecasts only using an unbiased methodology and our articles are not intended to be financial advice. It does not constitute a recommendation to buy or sell any stock, and does not take account of your objectives, or your financial situation. We aim to bring you long-term focused analysis driven by fundamental data. Note that our analysis may not factor in the latest price-sensitive company announcements or qualitative material. Simply Wall St has no position in any stocks mentioned.
Have feedback on this article? Concerned about the content? Get in touch with us directly. Alternatively, email editorial-team@simplywallst.com
About SEHK:968
Xinyi Solar Holdings
An investment holding company, produces and sells solar glass products in the People’s Republic of China, rest of Asia, North America, Europe, and internationally.
Flawless balance sheet with solid track record.

