- Hong Kong
- /
- Semiconductors
- /
- SEHK:243
QPL International Holdings' (HKG:243) Returns On Capital Are Heading Higher


What trends should we look for it we want to identify stocks that can multiply in value over the long term? Firstly, we'd want to identify a growing return on capital employed (ROCE) and then alongside that, an ever-increasing base of capital employed. Basically this means that a company has profitable initiatives that it can continue to reinvest in, which is a trait of a compounding machine. Speaking of which, we noticed some great changes in QPL International Holdings' (HKG:243) returns on capital, so let's have a look.
What Is Return On Capital Employed (ROCE)?
If you haven't worked with ROCE before, it measures the 'return' (pre-tax profit) a company generates from capital employed in its business. To calculate this metric for QPL International Holdings, this is the formula:
Return on Capital Employed = Earnings Before Interest and Tax (EBIT) ÷ (Total Assets - Current Liabilities)
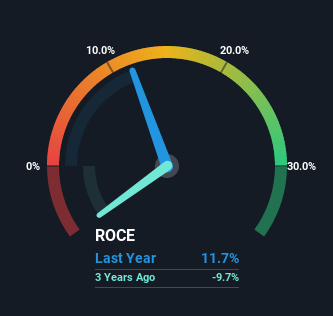
0.12 = HK$49m ÷ (HK$630m - HK$212m) (Based on the trailing twelve months to April 2022).
Therefore, QPL International Holdings has an ROCE of 12%. By itself that's a normal return on capital and it's in line with the industry's average returns of 12%.
View our latest analysis for QPL International Holdings
While the past is not representative of the future, it can be helpful to know how a company has performed historically, which is why we have this chart above. If you're interested in investigating QPL International Holdings' past further, check out this free graph of past earnings, revenue and cash flow.
The Trend Of ROCE
We're pretty happy with how the ROCE has been trending at QPL International Holdings. The data shows that returns on capital have increased by 25% over the trailing five years. That's a very favorable trend because this means that the company is earning more per dollar of capital that's being employed. In regards to capital employed, QPL International Holdings appears to been achieving more with less, since the business is using 40% less capital to run its operation. If this trend continues, the business might be getting more efficient but it's shrinking in terms of total assets.
For the record though, there was a noticeable increase in the company's current liabilities over the period, so we would attribute some of the ROCE growth to that. Essentially the business now has suppliers or short-term creditors funding about 34% of its operations, which isn't ideal. It's worth keeping an eye on this because as the percentage of current liabilities to total assets increases, some aspects of risk also increase.
In Conclusion...
In summary, it's great to see that QPL International Holdings has been able to turn things around and earn higher returns on lower amounts of capital. However the stock is down a substantial 78% in the last five years so there could be other areas of the business hurting its prospects. Regardless, we think the underlying fundamentals warrant this stock for further investigation.
On a final note, we've found 3 warning signs for QPL International Holdings that we think you should be aware of.
While QPL International Holdings isn't earning the highest return, check out this free list of companies that are earning high returns on equity with solid balance sheets.
If you're looking to trade QPL International Holdings, open an account with the lowest-cost platform trusted by professionals, Interactive Brokers.
With clients in over 200 countries and territories, and access to 160 markets, IBKR lets you trade stocks, options, futures, forex, bonds and funds from a single integrated account.
Enjoy no hidden fees, no account minimums, and FX conversion rates as low as 0.03%, far better than what most brokers offer.
Sponsored ContentValuation is complex, but we're here to simplify it.
Discover if QPL International Holdings might be undervalued or overvalued with our detailed analysis, featuring fair value estimates, potential risks, dividends, insider trades, and its financial condition.
Access Free AnalysisHave feedback on this article? Concerned about the content? Get in touch with us directly. Alternatively, email editorial-team (at) simplywallst.com.
This article by Simply Wall St is general in nature. We provide commentary based on historical data and analyst forecasts only using an unbiased methodology and our articles are not intended to be financial advice. It does not constitute a recommendation to buy or sell any stock, and does not take account of your objectives, or your financial situation. We aim to bring you long-term focused analysis driven by fundamental data. Note that our analysis may not factor in the latest price-sensitive company announcements or qualitative material. Simply Wall St has no position in any stocks mentioned.
About SEHK:243
QPL International Holdings
An investment holding company, manufactures and sells integrated circuit lead frames, heatsinks, stiffeners, and related products for semiconductor industry companies.
Excellent balance sheet and slightly overvalued.
Market Insights

Community Narratives

