- Hong Kong
- /
- Specialty Stores
- /
- SEHK:9992
Pop Mart International Group Limited's (HKG:9992) Intrinsic Value Is Potentially 82% Above Its Share Price


Key Insights
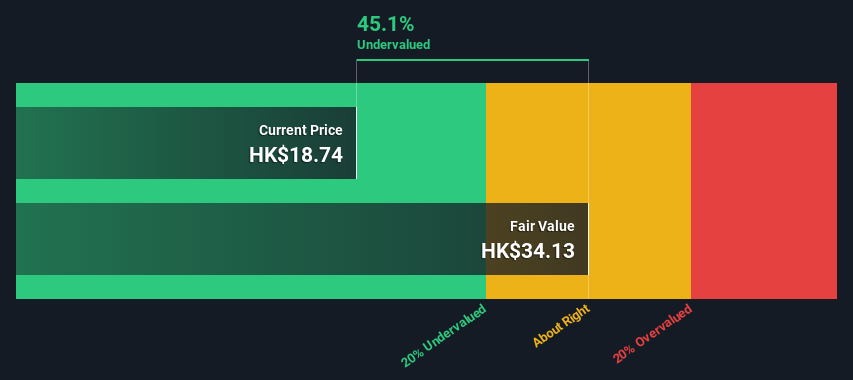
- Pop Mart International Group's estimated fair value is HK$34.13 based on 2 Stage Free Cash Flow to Equity
- Pop Mart International Group is estimated to be 45% undervalued based on current share price of HK$18.74
- The CN¥27.39 analyst price target for 9992 is 20% less than our estimate of fair value
Today we'll do a simple run through of a valuation method used to estimate the attractiveness of Pop Mart International Group Limited (HKG:9992) as an investment opportunity by taking the expected future cash flows and discounting them to today's value. The Discounted Cash Flow (DCF) model is the tool we will apply to do this. Don't get put off by the jargon, the math behind it is actually quite straightforward.
We generally believe that a company's value is the present value of all of the cash it will generate in the future. However, a DCF is just one valuation metric among many, and it is not without flaws. If you still have some burning questions about this type of valuation, take a look at the Simply Wall St analysis model.
See our latest analysis for Pop Mart International Group
Step By Step Through The Calculation
We're using the 2-stage growth model, which simply means we take in account two stages of company's growth. In the initial period the company may have a higher growth rate and the second stage is usually assumed to have a stable growth rate. To start off with, we need to estimate the next ten years of cash flows. Where possible we use analyst estimates, but when these aren't available we extrapolate the previous free cash flow (FCF) from the last estimate or reported value. We assume companies with shrinking free cash flow will slow their rate of shrinkage, and that companies with growing free cash flow will see their growth rate slow, over this period. We do this to reflect that growth tends to slow more in the early years than it does in later years.
A DCF is all about the idea that a dollar in the future is less valuable than a dollar today, and so the sum of these future cash flows is then discounted to today's value:
10-year free cash flow (FCF) forecast
| 2024 | 2025 | 2026 | 2027 | 2028 | 2029 | 2030 | 2031 | 2032 | 2033 | |
| Levered FCF (CN¥, Millions) | CN¥1.50b | CN¥1.96b | CN¥2.23b | CN¥2.45b | CN¥2.64b | CN¥2.79b | CN¥2.92b | CN¥3.04b | CN¥3.14b | CN¥3.23b |
| Growth Rate Estimate Source | Analyst x4 | Analyst x4 | Est @ 13.48% | Est @ 10.02% | Est @ 7.61% | Est @ 5.92% | Est @ 4.73% | Est @ 3.90% | Est @ 3.32% | Est @ 2.92% |
| Present Value (CN¥, Millions) Discounted @ 8.1% | CN¥1.4k | CN¥1.7k | CN¥1.8k | CN¥1.8k | CN¥1.8k | CN¥1.7k | CN¥1.7k | CN¥1.6k | CN¥1.6k | CN¥1.5k |
("Est" = FCF growth rate estimated by Simply Wall St)
Present Value of 10-year Cash Flow (PVCF) = CN¥17b
We now need to calculate the Terminal Value, which accounts for all the future cash flows after this ten year period. For a number of reasons a very conservative growth rate is used that cannot exceed that of a country's GDP growth. In this case we have used the 5-year average of the 10-year government bond yield (2.0%) to estimate future growth. In the same way as with the 10-year 'growth' period, we discount future cash flows to today's value, using a cost of equity of 8.1%.
Terminal Value (TV)= FCF2033 × (1 + g) ÷ (r – g) = CN¥3.2b× (1 + 2.0%) ÷ (8.1%– 2.0%) = CN¥54b
Present Value of Terminal Value (PVTV)= TV / (1 + r)10= CN¥54b÷ ( 1 + 8.1%)10= CN¥25b
The total value is the sum of cash flows for the next ten years plus the discounted terminal value, which results in the Total Equity Value, which in this case is CN¥41b. The last step is to then divide the equity value by the number of shares outstanding. Compared to the current share price of HK$18.7, the company appears quite undervalued at a 45% discount to where the stock price trades currently. Valuations are imprecise instruments though, rather like a telescope - move a few degrees and end up in a different galaxy. Do keep this in mind.
The Assumptions
We would point out that the most important inputs to a discounted cash flow are the discount rate and of course the actual cash flows. Part of investing is coming up with your own evaluation of a company's future performance, so try the calculation yourself and check your own assumptions. The DCF also does not consider the possible cyclicality of an industry, or a company's future capital requirements, so it does not give a full picture of a company's potential performance. Given that we are looking at Pop Mart International Group as potential shareholders, the cost of equity is used as the discount rate, rather than the cost of capital (or weighted average cost of capital, WACC) which accounts for debt. In this calculation we've used 8.1%, which is based on a levered beta of 1.011. Beta is a measure of a stock's volatility, compared to the market as a whole. We get our beta from the industry average beta of globally comparable companies, with an imposed limit between 0.8 and 2.0, which is a reasonable range for a stable business.
SWOT Analysis for Pop Mart International Group
- Currently debt free.
- Earnings declined over the past year.
- Dividend is low compared to the top 25% of dividend payers in the Specialty Retail market.
- Annual earnings are forecast to grow faster than the Hong Kong market.
- Trading below our estimate of fair value by more than 20%.
- No apparent threats visible for 9992.
Moving On:
Valuation is only one side of the coin in terms of building your investment thesis, and it is only one of many factors that you need to assess for a company. DCF models are not the be-all and end-all of investment valuation. Rather it should be seen as a guide to "what assumptions need to be true for this stock to be under/overvalued?" For example, changes in the company's cost of equity or the risk free rate can significantly impact the valuation. Why is the intrinsic value higher than the current share price? For Pop Mart International Group, there are three important factors you should assess:
- Financial Health: Does 9992 have a healthy balance sheet? Take a look at our free balance sheet analysis with six simple checks on key factors like leverage and risk.
- Future Earnings: How does 9992's growth rate compare to its peers and the wider market? Dig deeper into the analyst consensus number for the upcoming years by interacting with our free analyst growth expectation chart.
- Other High Quality Alternatives: Do you like a good all-rounder? Explore our interactive list of high quality stocks to get an idea of what else is out there you may be missing!
PS. The Simply Wall St app conducts a discounted cash flow valuation for every stock on the SEHK every day. If you want to find the calculation for other stocks just search here.
New: Manage All Your Stock Portfolios in One Place
We've created the ultimate portfolio companion for stock investors, and it's free.
• Connect an unlimited number of Portfolios and see your total in one currency
• Be alerted to new Warning Signs or Risks via email or mobile
• Track the Fair Value of your stocks
Have feedback on this article? Concerned about the content? Get in touch with us directly. Alternatively, email editorial-team (at) simplywallst.com.
This article by Simply Wall St is general in nature. We provide commentary based on historical data and analyst forecasts only using an unbiased methodology and our articles are not intended to be financial advice. It does not constitute a recommendation to buy or sell any stock, and does not take account of your objectives, or your financial situation. We aim to bring you long-term focused analysis driven by fundamental data. Note that our analysis may not factor in the latest price-sensitive company announcements or qualitative material. Simply Wall St has no position in any stocks mentioned.
About SEHK:9992
Pop Mart International Group
An investment holding company, engages in the design, development, and sale of pop toys in the People’s Republic of China and internationally.
Exceptional growth potential with flawless balance sheet.

