Henderson Investment (HKG:97) Has More To Do To Multiply In Value Going Forward

There are a few key trends to look for if we want to identify the next multi-bagger. One common approach is to try and find a company with returns on capital employed (ROCE) that are increasing, in conjunction with a growing amount of capital employed. Ultimately, this demonstrates that it's a business that is reinvesting profits at increasing rates of return. In light of that, when we looked at Henderson Investment (HKG:97) and its ROCE trend, we weren't exactly thrilled.
Understanding Return On Capital Employed (ROCE)
If you haven't worked with ROCE before, it measures the 'return' (pre-tax profit) a company generates from capital employed in its business. Analysts use this formula to calculate it for Henderson Investment:
Return on Capital Employed = Earnings Before Interest and Tax (EBIT) ÷ (Total Assets - Current Liabilities)
0.068 = HK$122m ÷ (HK$2.4b - HK$646m) (Based on the trailing twelve months to December 2020).
So, Henderson Investment has an ROCE of 6.8%. On its own that's a low return, but compared to the average of 5.6% generated by the Multiline Retail industry, it's much better.
View our latest analysis for Henderson Investment
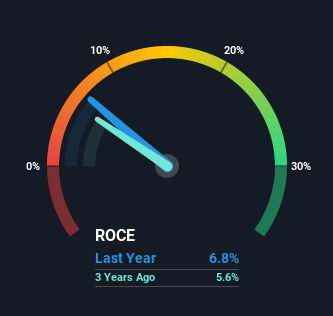
Historical performance is a great place to start when researching a stock so above you can see the gauge for Henderson Investment's ROCE against it's prior returns. If you want to delve into the historical earnings, revenue and cash flow of Henderson Investment, check out these free graphs here.
What Does the ROCE Trend For Henderson Investment Tell Us?
Over the past five years, Henderson Investment's ROCE and capital employed have both remained mostly flat. This tells us the company isn't reinvesting in itself, so it's plausible that it's past the growth phase. So unless we see a substantial change at Henderson Investment in terms of ROCE and additional investments being made, we wouldn't hold our breath on it being a multi-bagger.
Another point to note, we noticed the company has increased current liabilities over the last five years. This is intriguing because if current liabilities hadn't increased to 27% of total assets, this reported ROCE would probably be less than6.8% because total capital employed would be higher.The 6.8% ROCE could be even lower if current liabilities weren't 27% of total assets, because the the formula would show a larger base of total capital employed. So while current liabilities isn't high right now, keep an eye out in case it increases further, because this can introduce some elements of risk.
The Key Takeaway
We can conclude that in regards to Henderson Investment's returns on capital employed and the trends, there isn't much change to report on. Since the stock has declined 14% over the last five years, investors may not be too optimistic on this trend improving either. On the whole, we aren't too inspired by the underlying trends and we think there may be better chances of finding a multi-bagger elsewhere.
If you'd like to know more about Henderson Investment, we've spotted 3 warning signs, and 1 of them is a bit concerning.
If you want to search for solid companies with great earnings, check out this free list of companies with good balance sheets and impressive returns on equity.
When trading stocks or any other investment, use the platform considered by many to be the Professional's Gateway to the Worlds Market, Interactive Brokers. You get the lowest-cost* trading on stocks, options, futures, forex, bonds and funds worldwide from a single integrated account. Promoted
Valuation is complex, but we're here to simplify it.
Discover if Henderson Investment might be undervalued or overvalued with our detailed analysis, featuring fair value estimates, potential risks, dividends, insider trades, and its financial condition.
Access Free AnalysisThis article by Simply Wall St is general in nature. It does not constitute a recommendation to buy or sell any stock, and does not take account of your objectives, or your financial situation. We aim to bring you long-term focused analysis driven by fundamental data. Note that our analysis may not factor in the latest price-sensitive company announcements or qualitative material. Simply Wall St has no position in any stocks mentioned.
*Interactive Brokers Rated Lowest Cost Broker by StockBrokers.com Annual Online Review 2020
Have feedback on this article? Concerned about the content? Get in touch with us directly. Alternatively, email editorial-team (at) simplywallst.com.
About SEHK:97
Henderson Investment
An investment holding company, operates department stores, household specialty stores, and supermarkets in Hong Kong.
Good value with adequate balance sheet.
Similar Companies
Market Insights

Community Narratives

