- Hong Kong
- /
- Specialty Stores
- /
- SEHK:8536
Subdued Growth No Barrier To TL Natural Gas Holdings Limited (HKG:8536) With Shares Advancing 56%


TL Natural Gas Holdings Limited (HKG:8536) shares have had a really impressive month, gaining 56% after a shaky period beforehand. This latest share price bounce rounds out a remarkable 542% gain over the last twelve months.
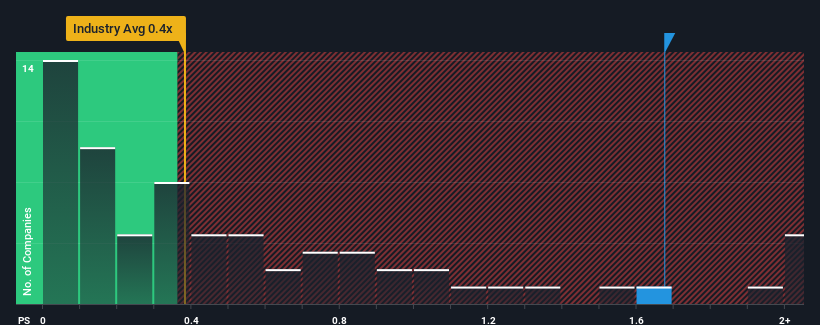
After such a large jump in price, given close to half the companies operating in Hong Kong's Specialty Retail industry have price-to-sales ratios (or "P/S") below 0.4x, you may consider TL Natural Gas Holdings as a stock to potentially avoid with its 1.7x P/S ratio. Although, it's not wise to just take the P/S at face value as there may be an explanation why it's as high as it is.
See our latest analysis for TL Natural Gas Holdings
What Does TL Natural Gas Holdings' Recent Performance Look Like?
The revenue growth achieved at TL Natural Gas Holdings over the last year would be more than acceptable for most companies. It might be that many expect the respectable revenue performance to beat most other companies over the coming period, which has increased investors’ willingness to pay up for the stock. However, if this isn't the case, investors might get caught out paying too much for the stock.
We don't have analyst forecasts, but you can see how recent trends are setting up the company for the future by checking out our free report on TL Natural Gas Holdings' earnings, revenue and cash flow.Do Revenue Forecasts Match The High P/S Ratio?
TL Natural Gas Holdings' P/S ratio would be typical for a company that's expected to deliver solid growth, and importantly, perform better than the industry.
Taking a look back first, we see that the company grew revenue by an impressive 15% last year. The latest three year period has also seen an excellent 53% overall rise in revenue, aided by its short-term performance. Accordingly, shareholders would have definitely welcomed those medium-term rates of revenue growth.
It's interesting to note that the rest of the industry is similarly expected to grow by 15% over the next year, which is fairly even with the company's recent medium-term annualised growth rates.
With this in mind, we find it intriguing that TL Natural Gas Holdings' P/S exceeds that of its industry peers. Apparently many investors in the company are more bullish than recent times would indicate and aren't willing to let go of their stock right now. Nevertheless, they may be setting themselves up for future disappointment if the P/S falls to levels more in line with recent growth rates.
The Key Takeaway
The large bounce in TL Natural Gas Holdings' shares has lifted the company's P/S handsomely. We'd say the price-to-sales ratio's power isn't primarily as a valuation instrument but rather to gauge current investor sentiment and future expectations.
Our examination of TL Natural Gas Holdings revealed its three-year revenue trends aren't impacting its high P/S as much as we would have predicted, given they look similar to current industry expectations. When we see average revenue with industry-like growth combined with a high P/S, we suspect the share price is at risk of declining, bringing the P/S back in line with the industry too. If recent medium-term revenue trends continue, it will place shareholders' investments at risk and potential investors in danger of paying an unnecessary premium.
It's always necessary to consider the ever-present spectre of investment risk. We've identified 4 warning signs with TL Natural Gas Holdings (at least 2 which make us uncomfortable), and understanding these should be part of your investment process.
Of course, profitable companies with a history of great earnings growth are generally safer bets. So you may wish to see this free collection of other companies that have reasonable P/E ratios and have grown earnings strongly.
If you're looking to trade TL Natural Gas Holdings, open an account with the lowest-cost platform trusted by professionals, Interactive Brokers.
With clients in over 200 countries and territories, and access to 160 markets, IBKR lets you trade stocks, options, futures, forex, bonds and funds from a single integrated account.
Enjoy no hidden fees, no account minimums, and FX conversion rates as low as 0.03%, far better than what most brokers offer.
Sponsored ContentValuation is complex, but we're here to simplify it.
Discover if TL Natural Gas Holdings might be undervalued or overvalued with our detailed analysis, featuring fair value estimates, potential risks, dividends, insider trades, and its financial condition.
Access Free AnalysisHave feedback on this article? Concerned about the content? Get in touch with us directly. Alternatively, email editorial-team (at) simplywallst.com.
This article by Simply Wall St is general in nature. We provide commentary based on historical data and analyst forecasts only using an unbiased methodology and our articles are not intended to be financial advice. It does not constitute a recommendation to buy or sell any stock, and does not take account of your objectives, or your financial situation. We aim to bring you long-term focused analysis driven by fundamental data. Note that our analysis may not factor in the latest price-sensitive company announcements or qualitative material. Simply Wall St has no position in any stocks mentioned.
About SEHK:8536
TL Natural Gas Holdings
An investment holding company, sells compressed natural gas (CNG) and liquefied natural gas in Jingzhou, China.
Flawless balance sheet low.
Market Insights

Community Narratives

