- Hong Kong
- /
- Specialty Stores
- /
- SEHK:8473
Mi Ming Mart Holdings Limited's (HKG:8473) Has Been On A Rise But Financial Prospects Look Weak: Is The Stock Overpriced?

Mi Ming Mart Holdings' (HKG:8473) stock is up by a considerable 37% over the past three months. We, however wanted to have a closer look at its key financial indicators as the markets usually pay for long-term fundamentals, and in this case, they don't look very promising. Specifically, we decided to study Mi Ming Mart Holdings' ROE in this article.
Return on equity or ROE is a key measure used to assess how efficiently a company's management is utilizing the company's capital. In short, ROE shows the profit each dollar generates with respect to its shareholder investments.
Our free stock report includes 5 warning signs investors should be aware of before investing in Mi Ming Mart Holdings. Read for free now.How To Calculate Return On Equity?
Return on equity can be calculated by using the formula:
Return on Equity = Net Profit (from continuing operations) ÷ Shareholders' Equity
So, based on the above formula, the ROE for Mi Ming Mart Holdings is:
7.2% = HK$10m ÷ HK$139m (Based on the trailing twelve months to September 2024).
The 'return' is the income the business earned over the last year. One way to conceptualize this is that for each HK$1 of shareholders' capital it has, the company made HK$0.07 in profit.
View our latest analysis for Mi Ming Mart Holdings
What Has ROE Got To Do With Earnings Growth?
So far, we've learned that ROE is a measure of a company's profitability. We now need to evaluate how much profit the company reinvests or "retains" for future growth which then gives us an idea about the growth potential of the company. Generally speaking, other things being equal, firms with a high return on equity and profit retention, have a higher growth rate than firms that don’t share these attributes.
A Side By Side comparison of Mi Ming Mart Holdings' Earnings Growth And 7.2% ROE
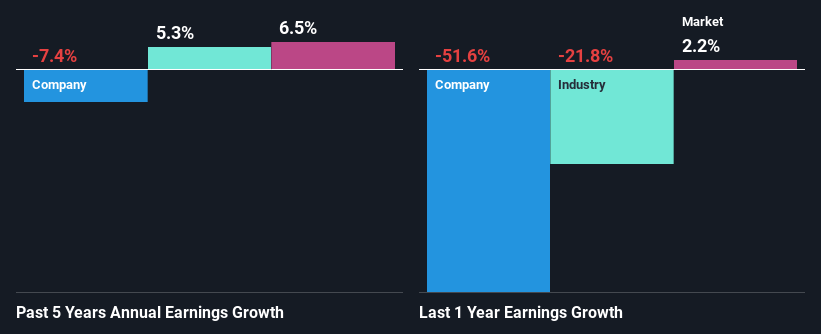
When you first look at it, Mi Ming Mart Holdings' ROE doesn't look that attractive. A quick further study shows that the company's ROE doesn't compare favorably to the industry average of 9.4% either. Therefore, it might not be wrong to say that the five year net income decline of 7.4% seen by Mi Ming Mart Holdings was probably the result of it having a lower ROE. We reckon that there could also be other factors at play here. Such as - low earnings retention or poor allocation of capital.
That being said, we compared Mi Ming Mart Holdings' performance with the industry and were concerned when we found that while the company has shrunk its earnings, the industry has grown its earnings at a rate of 5.3% in the same 5-year period.
Earnings growth is an important metric to consider when valuing a stock. The investor should try to establish if the expected growth or decline in earnings, whichever the case may be, is priced in. This then helps them determine if the stock is placed for a bright or bleak future. Has the market priced in the future outlook for 8473? You can find out in our latest intrinsic value infographic research report
Is Mi Ming Mart Holdings Using Its Retained Earnings Effectively?
Mi Ming Mart Holdings has a high three-year median payout ratio of 98% (that is, it is retaining 2.0% of its profits). This suggests that the company is paying most of its profits as dividends to its shareholders. This goes some way in explaining why its earnings have been shrinking. The business is only left with a small pool of capital to reinvest - A vicious cycle that doesn't benefit the company in the long-run. You can see the 5 risks we have identified for Mi Ming Mart Holdings by visiting our risks dashboard for free on our platform here.
In addition, Mi Ming Mart Holdings has been paying dividends over a period of six years suggesting that keeping up dividend payments is preferred by the management even though earnings have been in decline.
Conclusion
On the whole, Mi Ming Mart Holdings' performance is quite a big let-down. The low ROE, combined with the fact that the company is paying out almost if not all, of its profits as dividends, has resulted in the lack or absence of growth in its earnings. Until now, we have only just grazed the surface of the company's past performance by looking at the company's fundamentals. You can do your own research on Mi Ming Mart Holdings and see how it has performed in the past by looking at this FREE detailed graph of past earnings, revenue and cash flows.
If you're looking to trade Mi Ming Mart Holdings, open an account with the lowest-cost platform trusted by professionals, Interactive Brokers.
With clients in over 200 countries and territories, and access to 160 markets, IBKR lets you trade stocks, options, futures, forex, bonds and funds from a single integrated account.
Enjoy no hidden fees, no account minimums, and FX conversion rates as low as 0.03%, far better than what most brokers offer.
Sponsored ContentNew: Manage All Your Stock Portfolios in One Place
We've created the ultimate portfolio companion for stock investors, and it's free.
• Connect an unlimited number of Portfolios and see your total in one currency
• Be alerted to new Warning Signs or Risks via email or mobile
• Track the Fair Value of your stocks
Have feedback on this article? Concerned about the content? Get in touch with us directly. Alternatively, email editorial-team (at) simplywallst.com.
This article by Simply Wall St is general in nature. We provide commentary based on historical data and analyst forecasts only using an unbiased methodology and our articles are not intended to be financial advice. It does not constitute a recommendation to buy or sell any stock, and does not take account of your objectives, or your financial situation. We aim to bring you long-term focused analysis driven by fundamental data. Note that our analysis may not factor in the latest price-sensitive company announcements or qualitative material. Simply Wall St has no position in any stocks mentioned.
About SEHK:8473
Mi Ming Mart Holdings
An investment holding company, engages in the retail of multi-brand beauty and health products in Hong Kong.
Flawless balance sheet moderate.
Market Insights

Community Narratives

